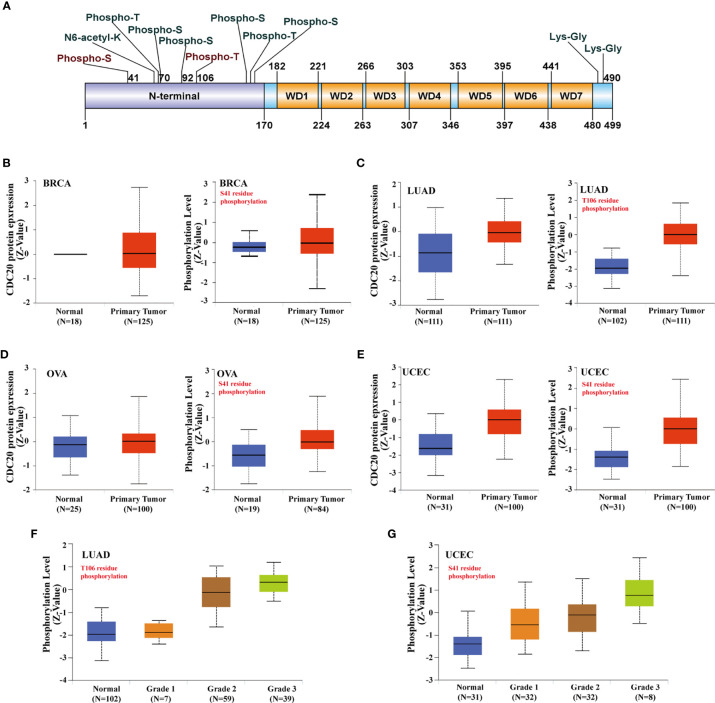
Figure 3.
Phosphorylation of Cdc20 protein in different cancer types and its clinical significance. (A) The phosphorylation sites of Cdc20 that have been verified are displayed in the schematic diagram of Cdc20 protein. Based on the CPTAC dataset, we analyzed the expression level of total Cdc20 protein and phosphorylated Cdc20 protein (S41 and T106 sites) between primary tumors of selected tumors and corresponding normal tissue via the UALCAN. (B) The protein abundance of Cdc20 total protein(left) and S41-phosphorylated protein(right) in BRCA tumor tissues and normal tissues, visualized in box plots. (C) The protein abundance of Cdc20 total protein(left) and T106-phosphorylated protein(right) in LUAD tumor tissues and normal tissues, visualized in box plots. (D) The protein abundance of Cdc20 total protein(left) and S41-phosphorylated protein(right) in OVA tumor tissues and normal tissues, visualized in box plots. (E) The protein abundance of Cdc20 S41-phosphorylated protein(right) in UCEC tumor tissues and normal tissues, visualized in box plots. (F) The protein abundance of Cdc20 T106-phosphorylated protein(right) in LUAD normal tissues and tumor tissues of different grades (grade1, grade2, grade3), visualized in box plots. (G) The protein abundance of Cdc20 S41-phosphorylated protein(right) in UCEC normal tissues and tumor tissues of different grade(grade1, grade2, grade3), visulized in box plots.

