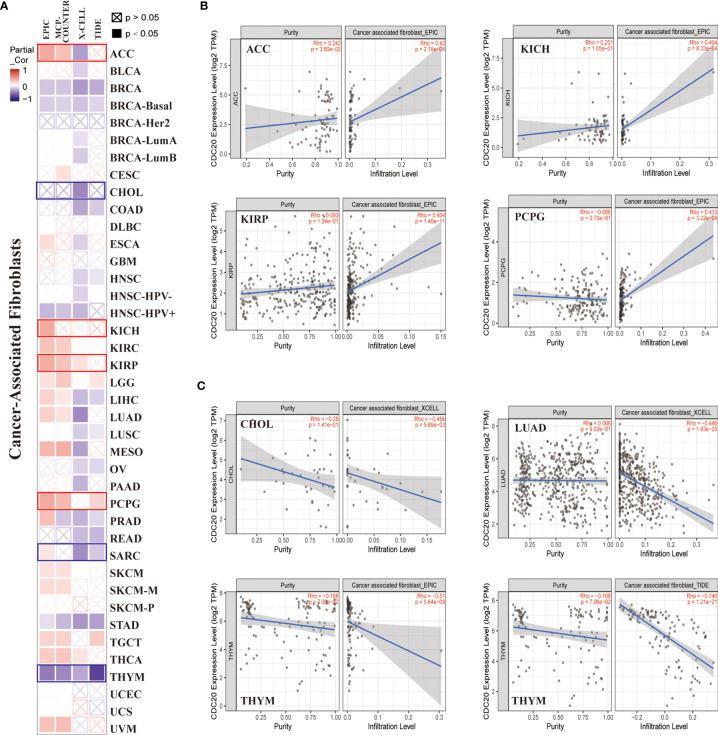
Figure 4.
The correlation between CDC20 expression and immune infiltration of cancer-associated fibroblasts. (A) The potential correlation between the expression level of the CDC20 gene and the infiltration level of cancer-associated fibroblasts across 33 subtypes of cancer in TCGA using different algorithms by TIMER2.0, visualized in a heatmap by Spearmans’ Rho value. (B, C) The expression levels of the CDC20 gene are positively or negatively correlated with the infiltration level of cancer-associated fibroblasts by the cut-off value of 0.4 of Spearmans’ Rho Value in selected cancer types.

