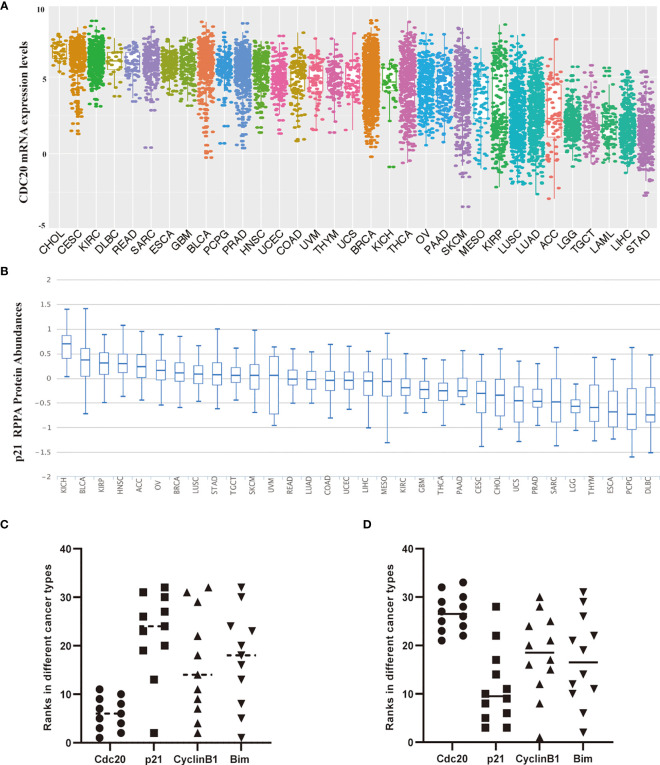
Figure 5.
The correlation of protein abundance between Cdc20 total protein and its ubiquitination substrates in different cancer types. (A) The mRNA expression levels of the CDC20 gene in specific cancers or cancer subtypes from the TCGA database. The names of cancer types or subtypes are arranged in descending order of CDC20 express levels. (B) The p21 protein levels in different types of cancers by RPPA using the samples from TCGA. The names of cancer types or subtypes are arranged in descending order of p21 protein abundance. (C) Scatter plots visualize the ranks of Cdc20 and its substrates(p21, CyclinB1, and Bim) in specific cancer types. The cancer types in the top 11 ranks with Cdc20 high expression are selected. (D) Scatter plots visualize the ranks of Cdc20 and its substrates(p21, CyclinB1, and Bim) in specific cancer types. The cancer types in the last 12 ranks with the Cdc20 expression list are selected.

