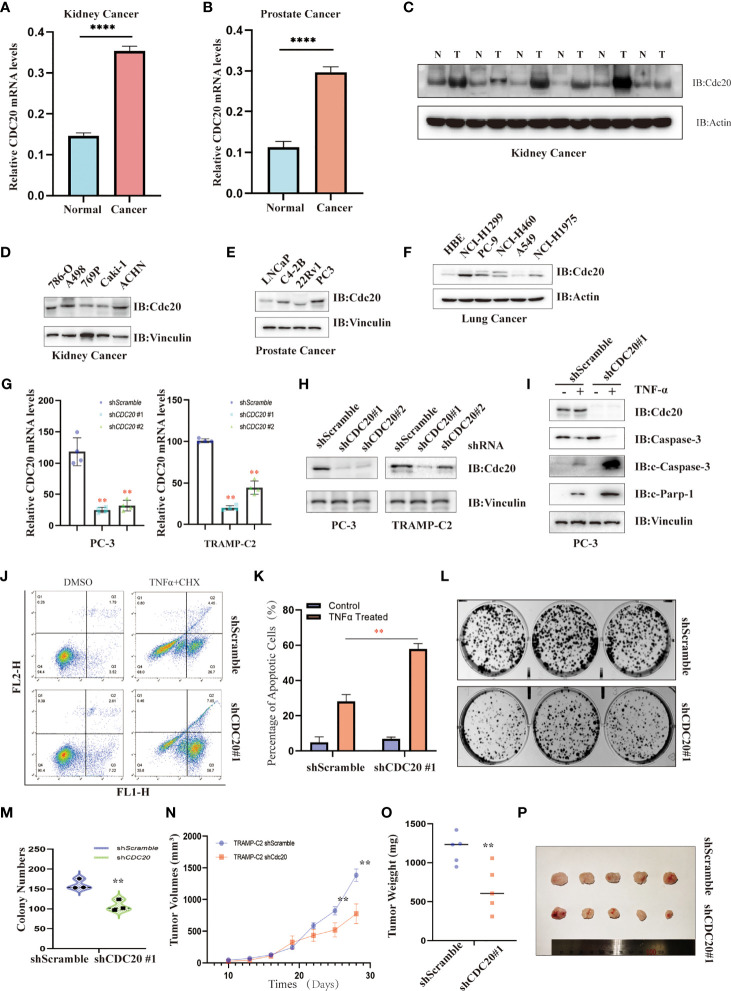
Figure 7.
The functional validation of Cdc20. (A, B) Oncopression database was utilized to verify the differential expression of CDC20 in the kidney (A) and prostate cancer (B), as well as their matched normal tissues. **P < 0.01. (C) Immunoblotting was used to detect the abundance of Cdc20 levels in tumor tissues (T) and matched normal tissues (N) of renal cell carcinoma. (D–F) Immunoblotting was used to detect the abundance of Cdc20 levels in cancer cell lines derived from kidney cancer (D), prostate cancer (E), and lung cancer (F). (G) Quantitative RT-PCR was utilized to detect the relative CDC20 mRNA levels in PC-3 and TRAMP-C2 cell lines with or without CDC20 stably knockdown, respectively. (H) Immunoblotting was used to detect the abundance of Cdc20 levels in PC-3 and TRAMP-C2 cell lines with or without CDC20 stably knockdown, respectively. (I) Immunoblotting was used to detect the abundance of Cdc20 and apoptosis markers in PC-3 with or without CDC20 stably knockdown treated with TNF-α (20 ng/ml) and Cycloheximide (10μM) for 4 hours before sampling. (J, K) Annexin-V and Propidium Iodide staining followed by FACS analysis to detect the proportion of apoptotic PC3 cells with or without CDC20 stably knockdown treated with TNF-α (20 ng/ml) and Cycloheximide (10μM) for 4 hours before staining (J). The quantification of three independent replicates was statistically analyzed and visualized (K). (L, M) The representative photograph of colonic formation results in PC3 cells with or without CDC20 stably knockdown (L). The quantification of three independent replicates was statistically analyzed and visualized (M). (N–P) A subcutaneous tumor mouse model was generated by injection of 5*105 TRAMP-C2 cells with or without knockdown of CDC20 in immune-competent C57BL/6J mice. The tumor volume (N) and weight (O) were recorded and statistically analyzed. Tumor xenografts of each group are shown (P). **P < 0.01; ****P < 0.0001.

