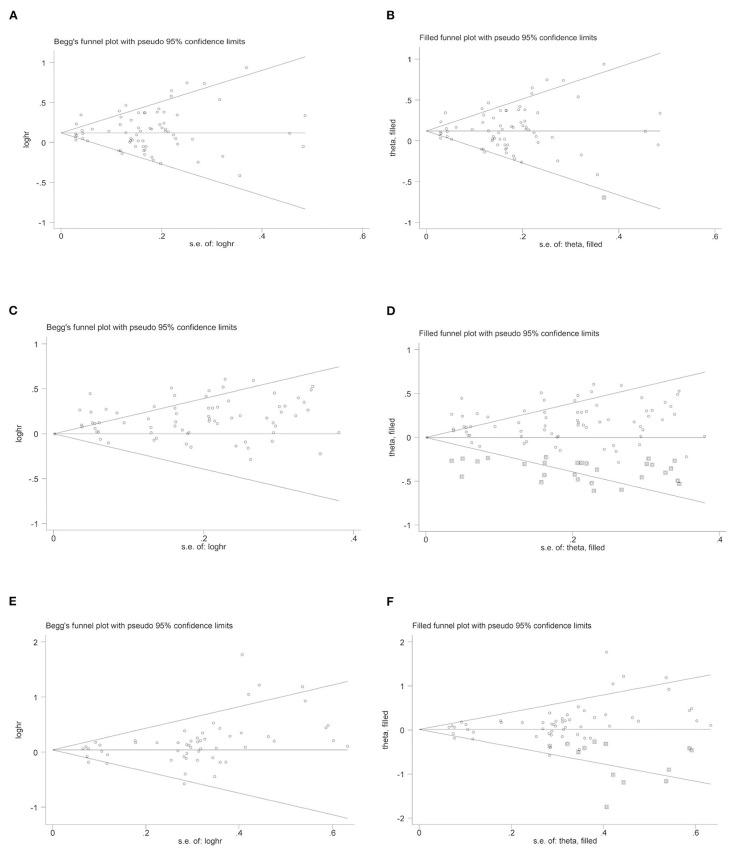
Figure 3.
Begg's and filled funnel plots on the association of uric acid levels and risk of stroke. (A) Begg's funnel plot and (B) Filled funnel plots: UA levels and total stroke. (C) Begg's funnel plot and (D) Filled funnel plots: UA levels and ischemic stroke. (E) Begg's funnel plot and (F) Filled funnel plots: UA levels and hemorrhagic stroke.

