Figure 5.

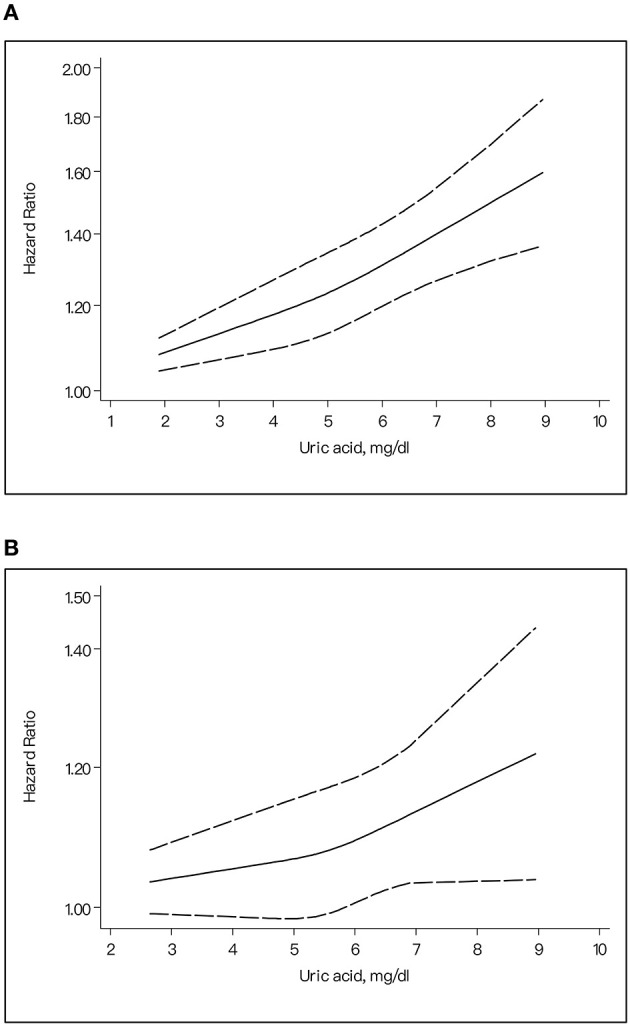
The dose-response plot on the association of uric acid levels and risk of stroke for different gender. (A) Female. (B) Male.

The dose-response plot on the association of uric acid levels and risk of stroke for different gender. (A) Female. (B) Male.