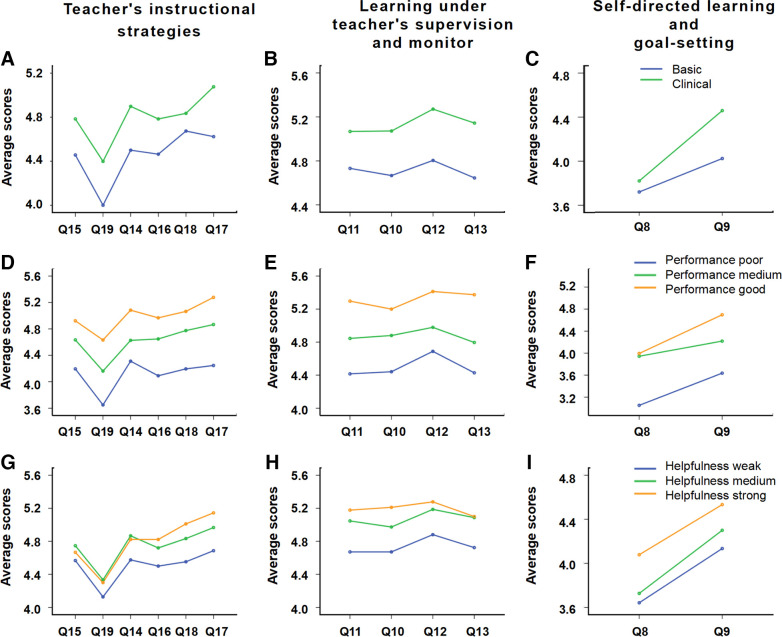
Figure 2.
The correlations between the scores for each question in the three groups (i.e., course attribute, academic performance, and perception of helpfulness) and the recognized 3 key factors. A–I: A–C: from the group of medical course attributes; D-F: from the group of students’ academic performance; G–I: from the group of students’ perception of helpfulness. The vertical axis is the scores of each question in the survey, and the horizontal axis represents the series number of the question.

