
FIGURE 2.
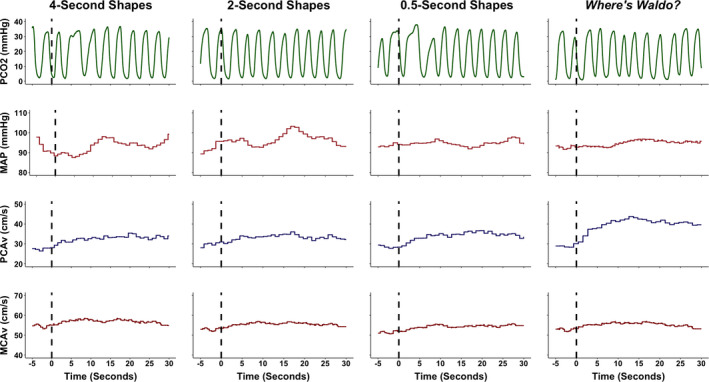
A representative trace from an individual during each of the four tasks. These included viewing simple geometric shapes of different colors that changed location on a screen at different speeds (i.e., 4‐, 2‐, and 0.5‐s) and a complex visual scene search “Where's Waldo?”. The dashed line signals the eyes‐open period where the participant begun to engage in each respective task. The 5‐s prior to the eyes‐open stimulus was utilized to determine the baseline eyes‐closed metrics; whereas the 30 seconds following the eyes‐open stimulus was used to quantify the neurovascular coupling response. The partial pressure of carbon dioxide (PCO2), millimeters of mercury (mmHg), mean arterial pressure (MAP), posterior cerebral artery blood velocity (PCAv), centimeter per second (cm/s), and middle cerebral artery blood velocity (MCAv)