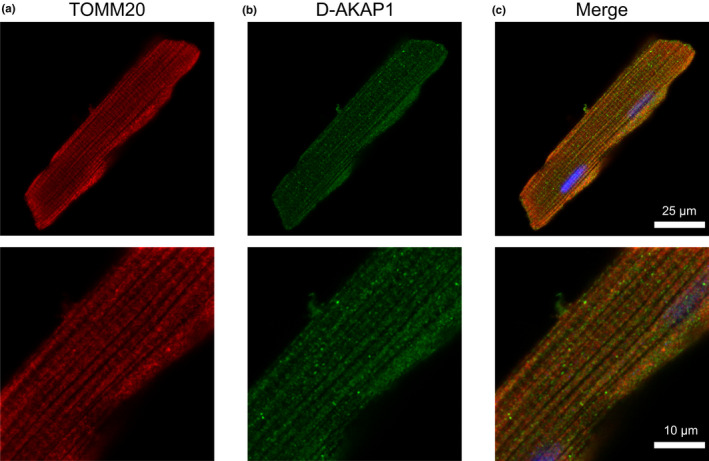
FIGURE 3.

Co‐localization of D‐AKAP1 and mitochondria in ARVM. Representative confocal images of ARVM showing mitochondrial marker (a) TOMM20 and (b) D‐AKAP1. (c) Merged image of TOMM20 (red), D‐AKAP1 (green), and DAPI (blue) shows that D‐AKAP1 overlaps the mitochondrial marker. PCC = 0.77 ± 0.03; N = 4 independent isolations with n = 6 from each isolation. Magnified images are shown below each corresponding image with the appropriate scale bar
