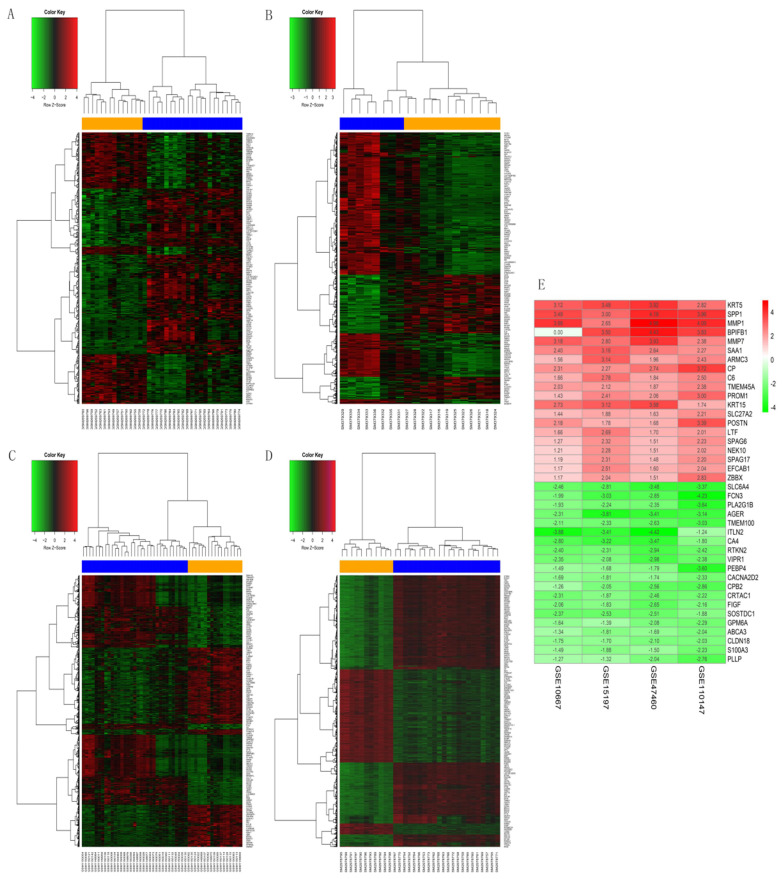
Figure 2.
Heatmaps of DEGs in GSE10667, GSE15197, GSE47460, and GSE110147. (A) GSE10667, (B) GSE15197, (C) GSE47460, (D) GSE110147. (E) RobustRankAggreg (RRA) of four mRNA datasets. A-D: Blue, IPF; yellow, normal lung tissues. A-E: red and green, upregulated genes and downregulated genes, respectively.

