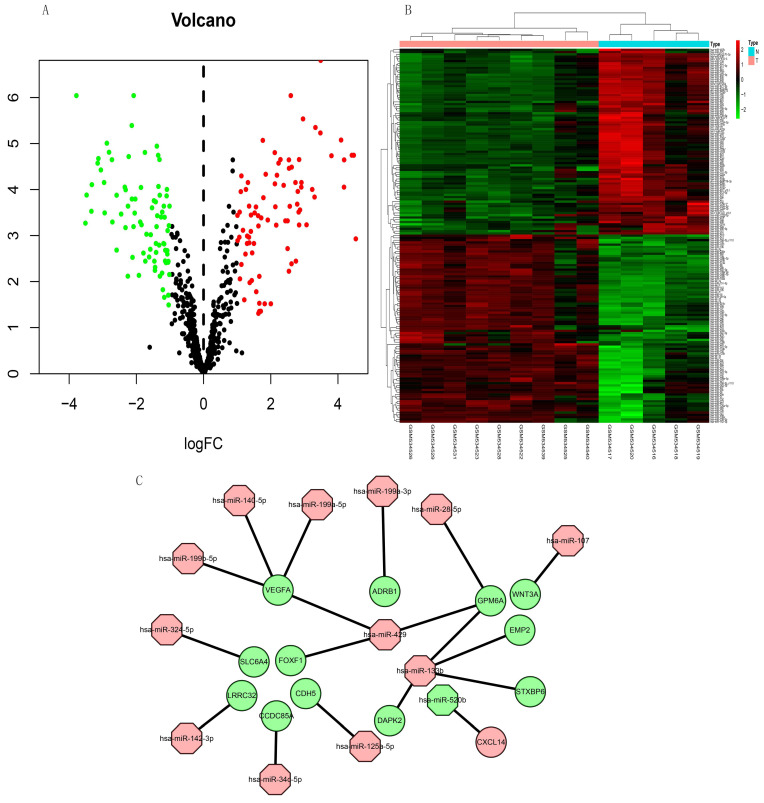
Figure 7.
Volcano plot and heat map of DEMs in miRNA dataset GSE21394. (A) Volcano plot shows 83 upregulated (red dots), 82 downregulated (green dots), and not significantly changed mRNAs (black dots). (B) Heatmap of the DE-miRNAs of GSE21394. (C) Regulatory miRNA-mRNA network. Red and green, upregulation and downregulation, respectively. N, normal tissues; T, idiopathic pulmonary fibrosis.

