Figure 4.

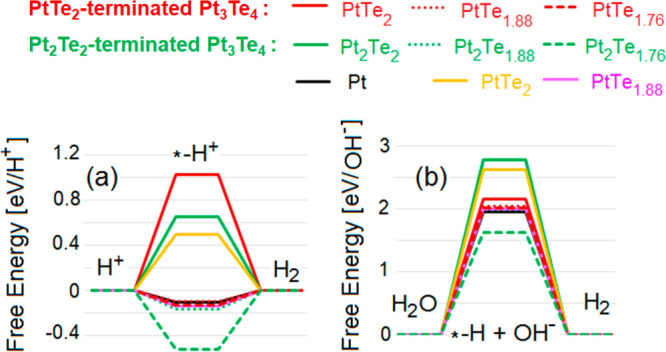
Free energy diagrams for HER in (a) acidic and (b) alkali media on various surfaces of Pt3Te4. Red lines denote results for the PtTe2-terminated Pt3Te4 surface, while green lines are related to the Pt2Te2 surface termination of Pt3Te4. Results for both defect-free and defective surfaces are shown. For the sake of comparison, also values for bulk Pt, PtTe2, and PtTe1.88 are reported. The symbol “*” corresponds to the substrate.
