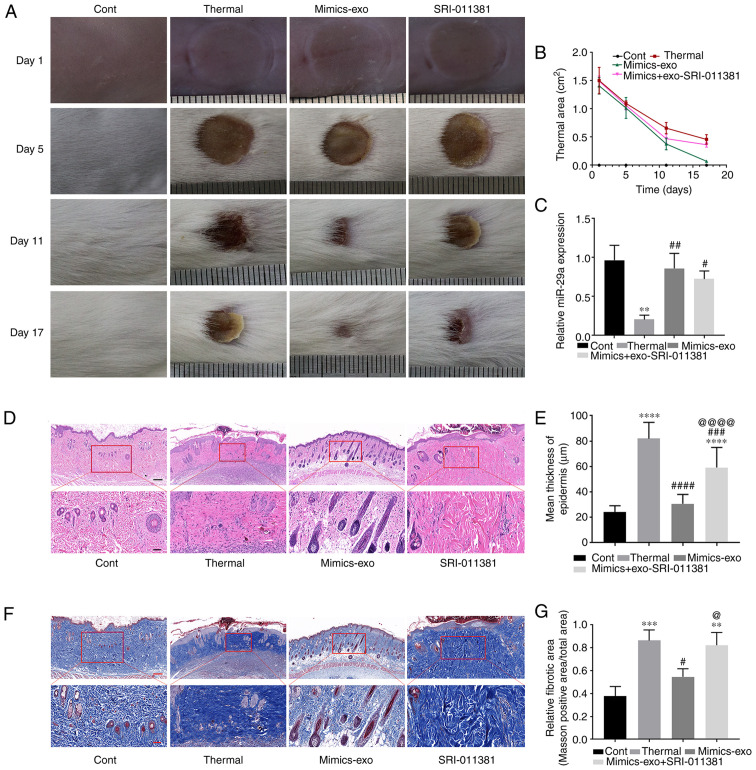
Figure 6.
Effect of miR-29a-overexpressing hADSCs-exo on scar formation in thermally injured mice. (A) Representative images of thermal injury of mice on days 1, 5, 11 and 17 after injury. (B) Thermal areas in each group. (C) miR-29a expression in thermally injured tissues of different groups. (D) Representative images of H&E staining of scar tissues. (E) Epidermal thicknesses in different groups. (F) Representative images of Masson staining of scar tissues. (G) Relative fibrotic areas in different groups. Bars in the upper panel of D and F indicate 200 µm, while the bar indicates 50 µm in the lower panel. One-way ANOVA followed by Bonferroni post hoc test was used to compare the differences among different groups. **P<0.01, ***P<0.001, ****P<0.0001 vs. Cont group; #P<0.05, ##P<0.01, ###P<0.001, ####P<0.0001 vs. thermal group; @P<0.05, @@@@P<0.0001 vs. mimics-exo group. Cont, control; mimics-exo, exosomes from miR-29a overexpressed hADSCs treated group; inhibitor-exo, exosomes from miR-29a knockdown hADSCs treated group; hADSCs, human adipose-derived mesenchymal stem cells; miR, microRNA.

