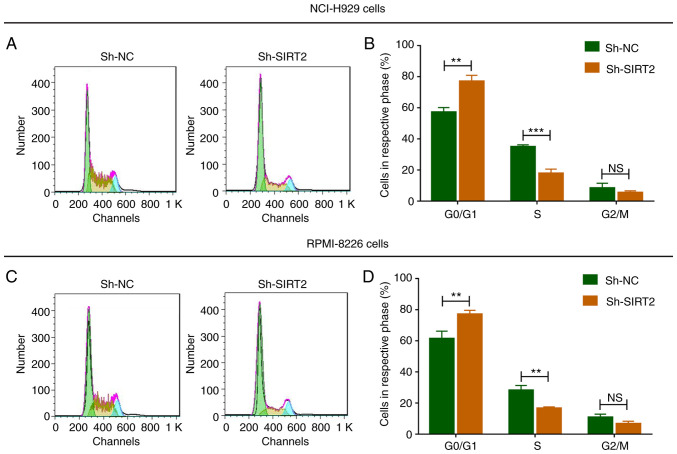
Figure 5.
Cell cycle analysis of NCI-H929 and RPMI-8226 cells post-transfection. Comparison of cell percentages between the Sh-SIRT2 and Sh-NC groups following transfection into (A and B) NCI-H929 and (C and D) RPMI-8226 cells. The percentages of cells at G0/G1, S and G2/M phases are shown. **P<0.01, ***P<0.001. SIRT2, sirtuin 2; Sh-SIRT2, shRNA-SIRT2; Sh-NC, shRNA-negative control; shRNA, short hairpin RNA.

