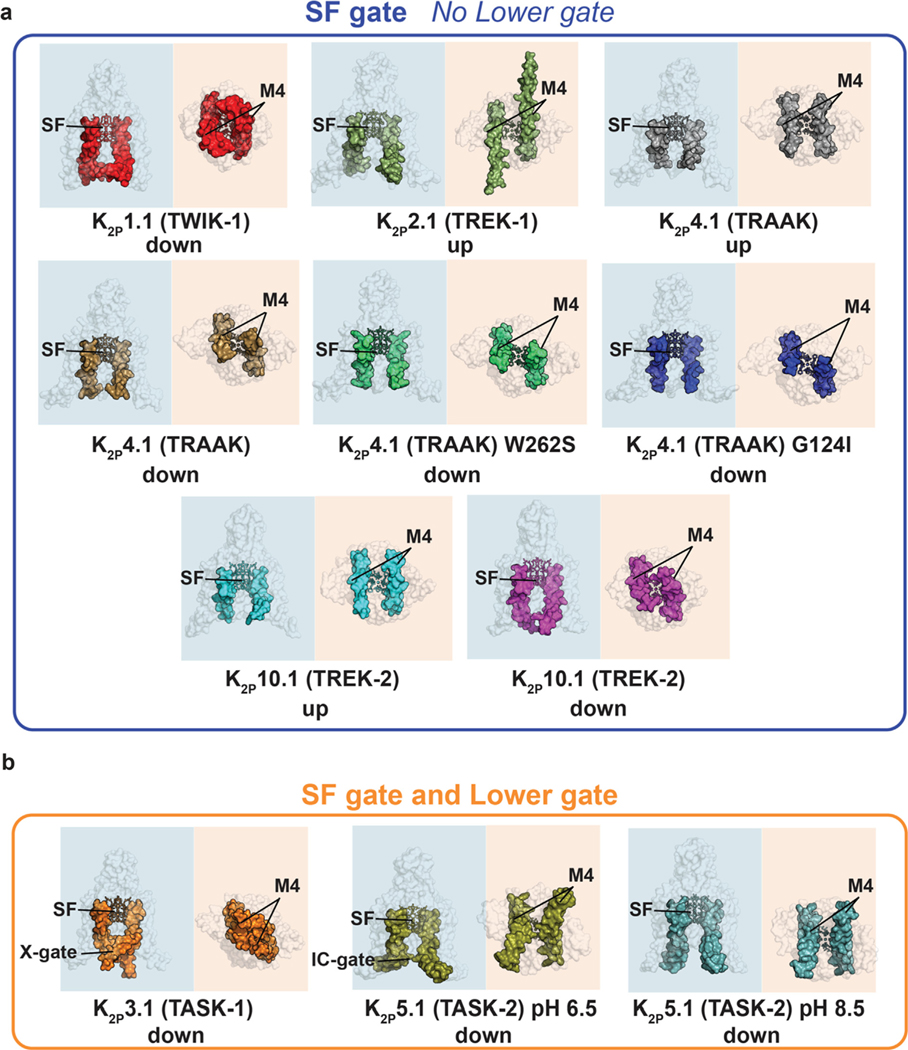
Figure 3.
K2P structure comparison highlighting the M4 position and presence or absence of a lower gate. (a) K2Ps having only the SF gate: K2P1.1 (TWIK-1) (PDB:3UKM),36 K2P2.1 (TREK-1) (PDB:6CQ6),37 K2P4.1 (TRAAK) (PDB:4WFG),58 K2P4.1 (TRAAK) (PDB:4WFF),58 K2P4.1 W262S (PDB:4RUF),57 K2P4.1 (TRAAK) G124I (PDB:4RUE),57 K2P10.1 (TREK-2) (PDB:4BW5),40 K2P10.1 (TREK-2) (PDB:4XDJ).40 (b) K2Ps having both an SF gate and a Lower gate K2P3.1 (TASK-1) (PDB:6RV2)38 and K2P5.1 (TASK-2) pH 8.5 (PDB:6WM0).41 SF, M4, X-gate, Intracellular gate (IC gate) are indicated. ‘Up’ and ‘down’ indicate M4 position. Shading indicates view from the side (blue) and intracellular face (orange).

