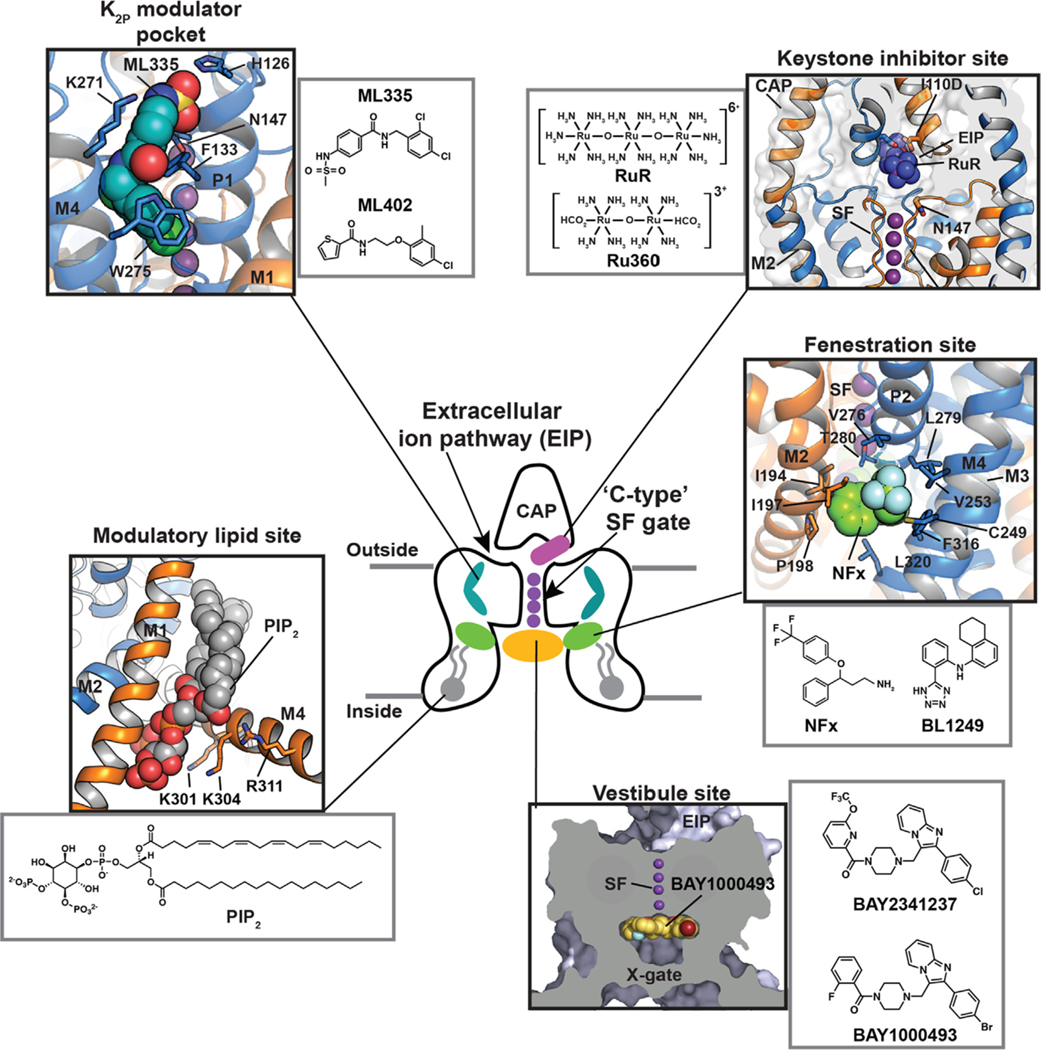
Figure 6.
Polysite model of K2P structural pharmacology. Central cartoon shows the locations of structurally defined K2P small molecule binding sites including the Keystone inhibitor site (magenta) (PDB: 6V3I),51 K2P modulator pocket (cyan) (PDB:6CQ8),37 Fenestration site (green) (PDB:4XDK),40 Modulatory lipid site (grey) (PDB:6W8C),53 and Vestibule site (orange) (PDB: 6RV3).38 Cap, Extracellular ion pathway (EIP), and ‘C-type’ SF gate are indicated. Potassium ions are shown (purple). Grey lines denote the lipid bilayer. Black boxes show the details of the individual sites. Grey boxes show modulator chemical structures. X-gate is not shown in the central cartoon.

