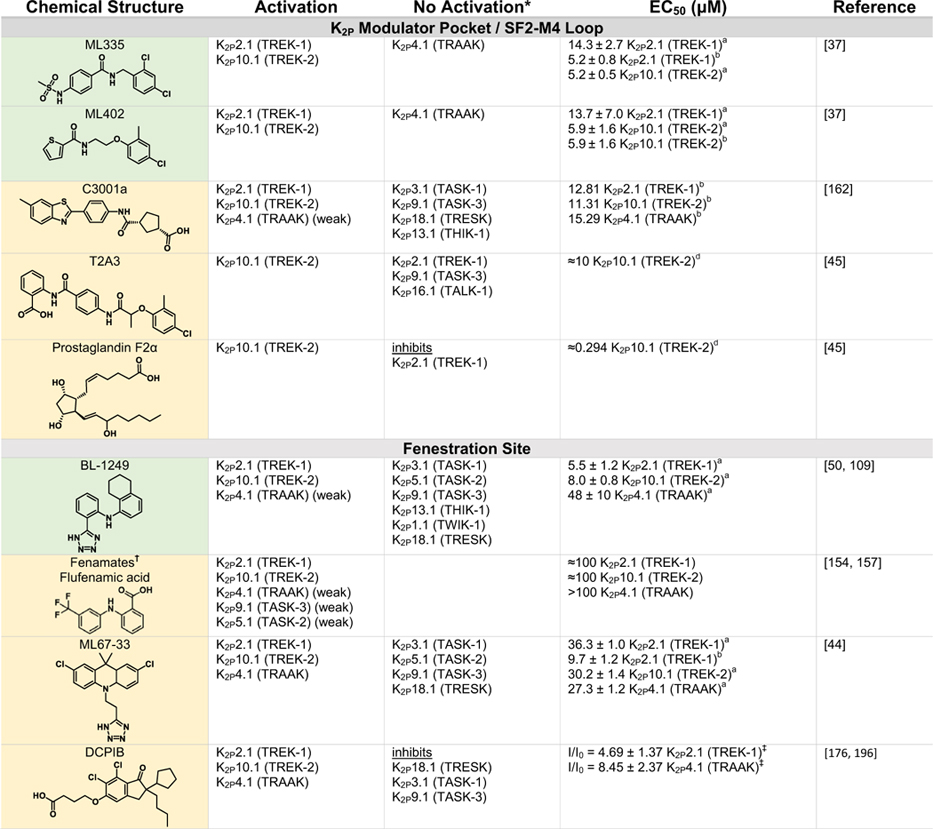
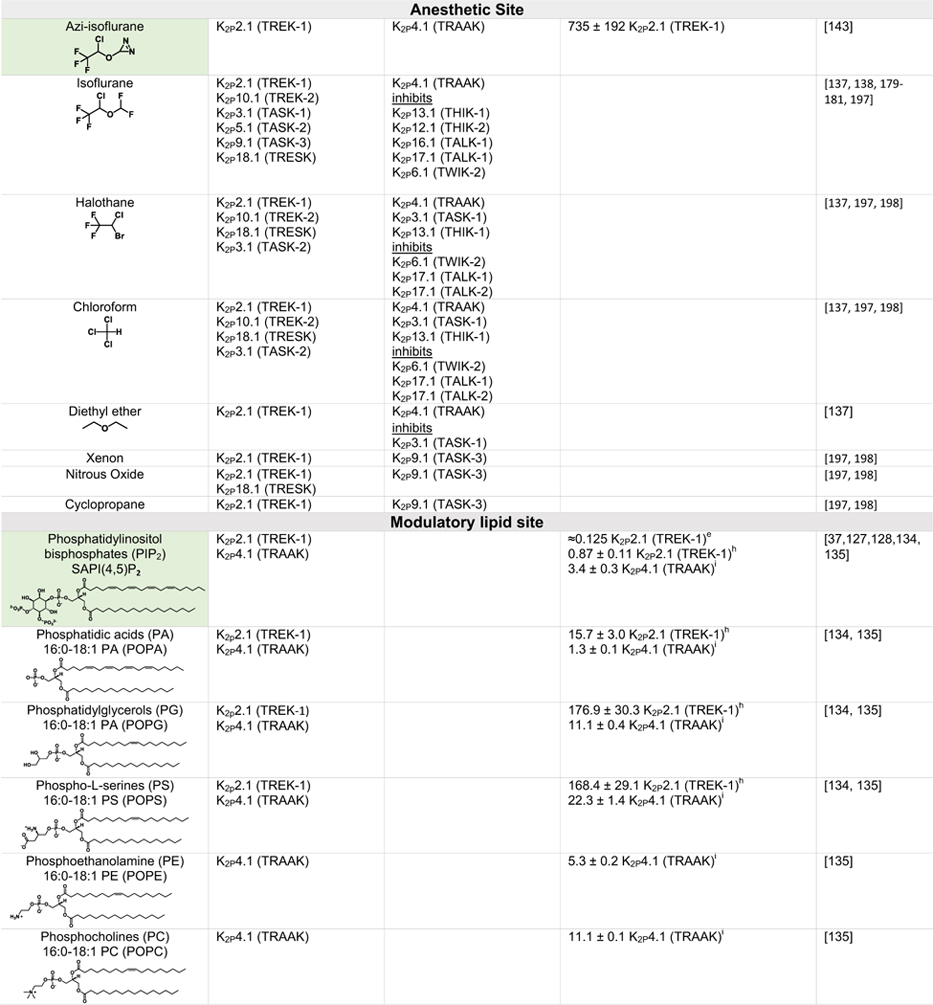
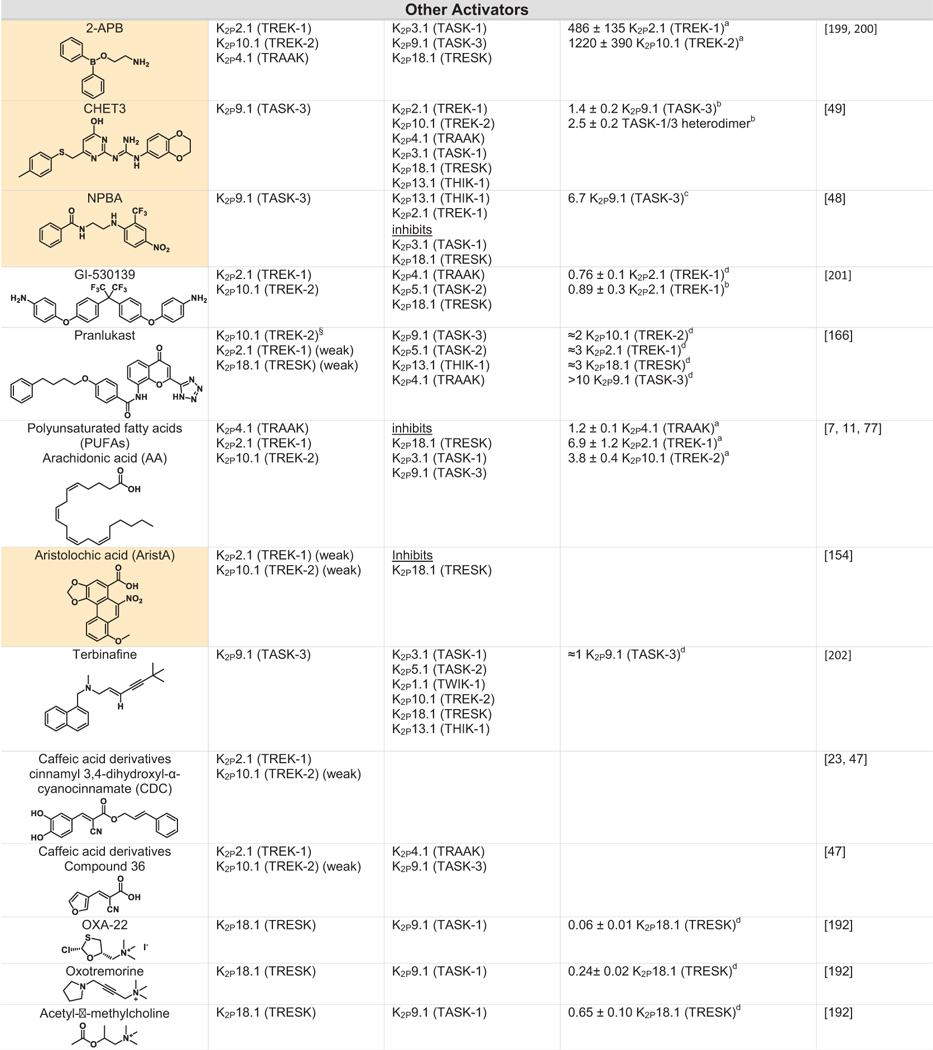
Table 2.

|

|

|
Green indicates structurally validated activators Yellow indicates activators supported by mutagenesis or mutagenesis combined with simulation studies. Cells used to measure activity are indicated as follows
Oocytes,
HEK cells,
CHO Cells,
Thallium flux assay,
COS cells,
tsA201 cells,
AZF cells,
fluorescent binding assay,
Kd values from native mass spectrometry with K2P4.1a (TRAAK) isoform.
Only K2Ps tested against the activator are listed (other K2Ps may not have been tested).
Other closely related fenamates like mefenamic acid and niflumic acid possess similar activity and selectivity to flufenamic acid.
I/I0 values at 10 lM DCPIB. EC50 values were not determined as Emax was not reached, even at very high DCPIB concentrations (100 lM).
While the EC50s for Pranlukast against the TREK family are nearly identical, the fold-activation observed for K2P10.1 (TREK-2) was much higher than for K2P2.1 (TREK-1) or K2P4.1 (TRAAK).
