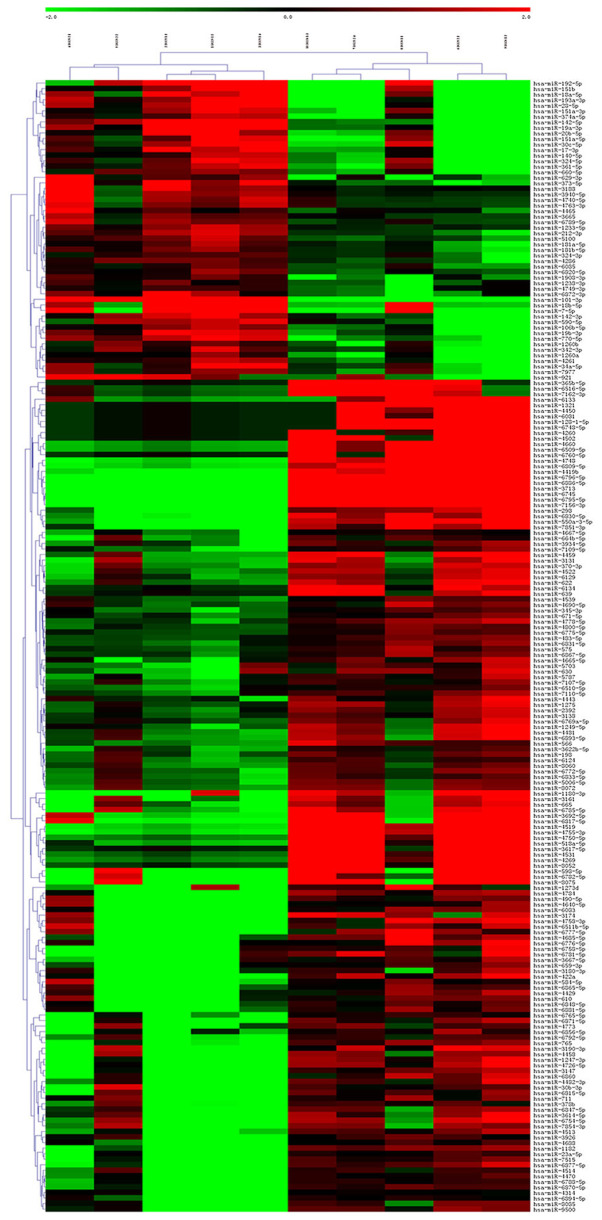
Figure 4.
Results of unsupervised hierarchical cluster analysis of the 204 differentially expressed microRNAs as shown by a heat map. The color scale indicates the change in gene expression from relatively low (green) to relatively high (red) levels. The row name represents the sample name, while the column name represents the probe name.

