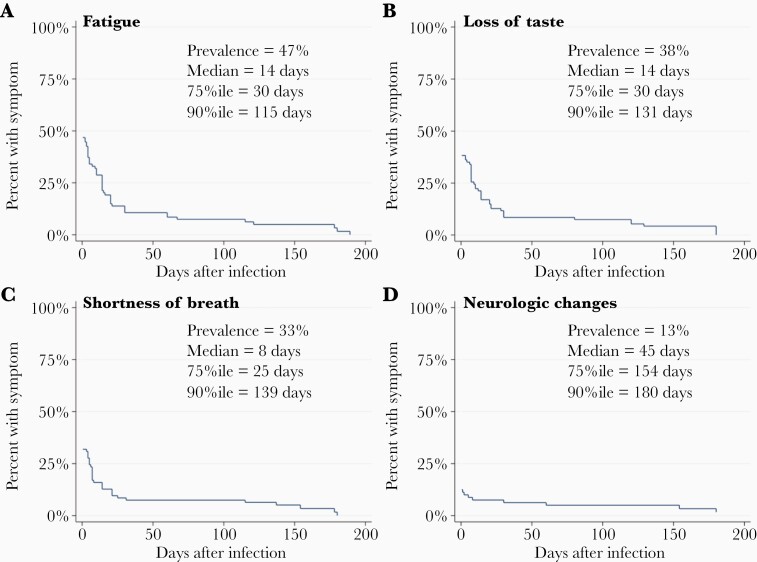
Figure 4.
Duration of selected symptoms in infected RCC participants. Kaplan-Meier plots show prevalence and time course (in days) of 4 selected symptoms among infected RCC participants from infection to resolution: (A) fatigue; (B) loss of taste; (C) shortness of breath; and (D) neurologic changes besides altered taste or smell, eg, altered cognition or visual changes. Symptoms are shown in decreasing order of overall prevalence (A–D). Median, 75th, and 90th percentiles are indicated for each symptom among those who reported the symptom. Abbreviations: %ile, percentile; RCC, Rutgers Corona Cohort.

