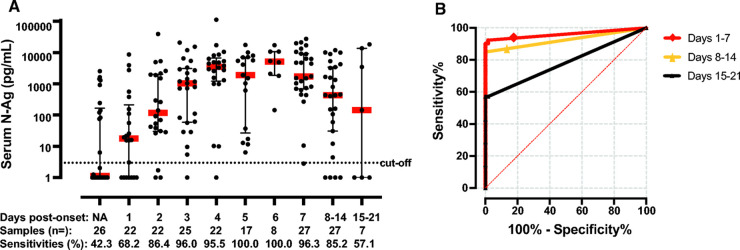
Fig. 1.
(A) Kinetics of serum N-Ag concentrations by days after symptom onset. Each dot indicates 1 serum specimen that was collected on the same day of NP swab collection for viral RNA test; each red line indicates the mean value in each time-period group. Cutoff was set at 2.97 pg/mL. NA indicates the information of day from symptom onset is not available as cases were asymptomatic at the time of sample collection. (B) The receiver operating characteristic curves for serum N-Ag within the indicated weekly time frames. Areas under the receiver operating characteristic curve are 0.961 (days 1–7), 0.925 (days 8–14), and 0.782 (days 15–21).

