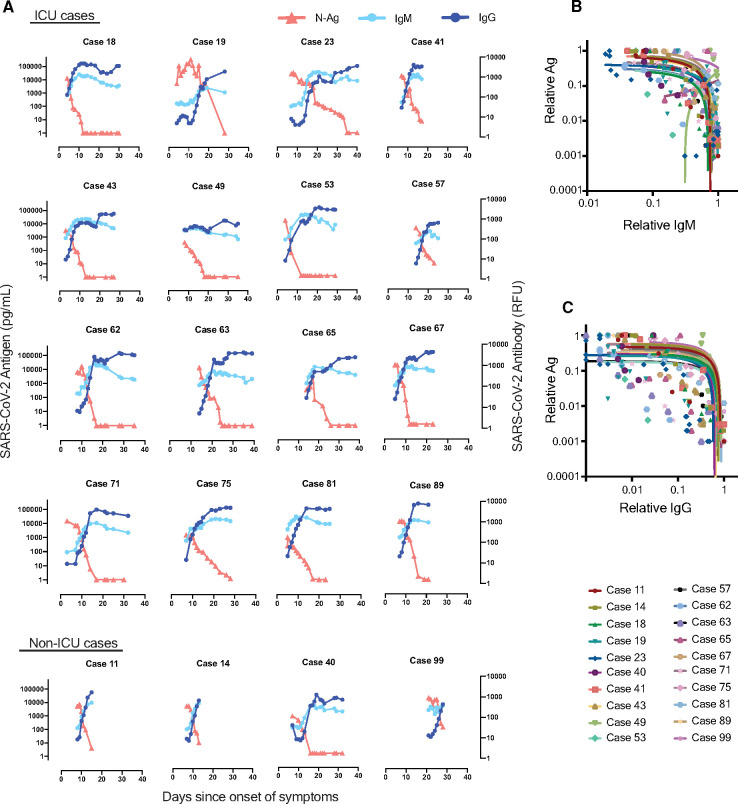
Fig. 3.
(A) Kinetics of N-Ag concentrations and IgM and IgG responses for 20 hospitalized patients by days after symptom onset. For ICU cases, all cases with ≥7 time points and at least 1 time point >21 days were included. For non-ICU cases, all cases with ≥7 time points were included regardless of sample collection date. (B) Inverse relationship between N-Ag and IgM in the 20 cases. (C) Inverse relationship between N-Ag and IgG in the 20 cases. To calculate the relative level in each case, Ag and Ab concentrations were normalized to the highest one found in each case.

