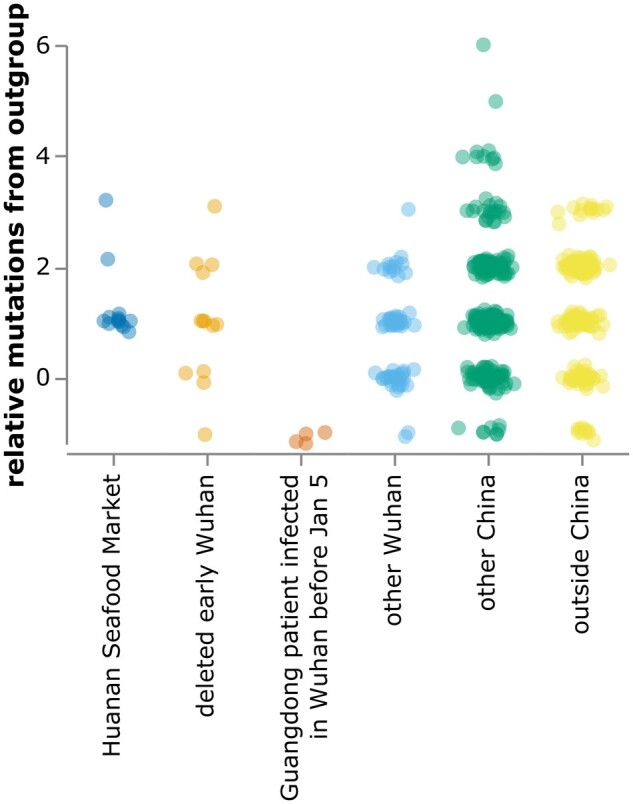
Fig. 4.

Relative mutational distance from RaTG13 bat coronavirus outgroup calculated only over the region of the SARS-CoV-2 genome covered by sequences from the deleted data set (21,570–29,550). Because the calculated distances here are only over a portion of the genome, there are more negative points than in fig. 2. The plot shows sequences in GISAID collected before February 2020, as well as the 13 early Wuhan epidemic sequences in table 1. Mutational distance is calculated relative to proCoV2, and points are jittered on the y-axis. Go to https://jbloom.github.io/SARS-CoV-2_PRJNA612766/deltadist_jitter.html for an interactive version of this plot that enables toggling the outgroup to RpYN06 or RmYN02, mouseovers to see details for each point, and adjustment of jittering.
