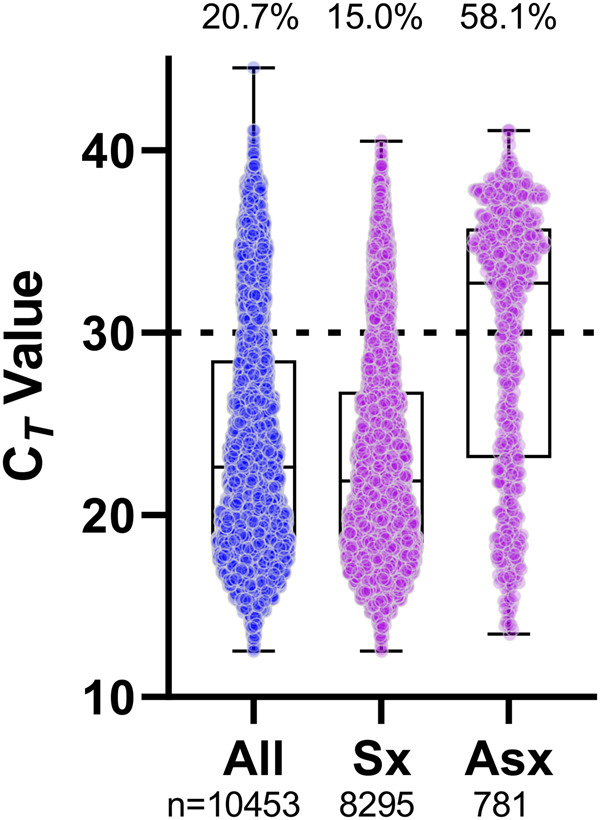
Fig. 3.

Distribution of SARS-CoV-2 E gene Ct values from positive NP specimens grouped by symptom status and detected on the Roche cobas 6800. All data points are shown in the first column and subsequently grouped by symptom status, if indicated on the order. The number of specimens is shown under the column. The percentage of specimens with Ct values greater than 30 (dashed line) is shown at the top of the column. Standard box and whisker plots show the median and interquartile range (box) and full range (whiskers) of data. Sx, symptomatic; Asx, asymptomatic.
