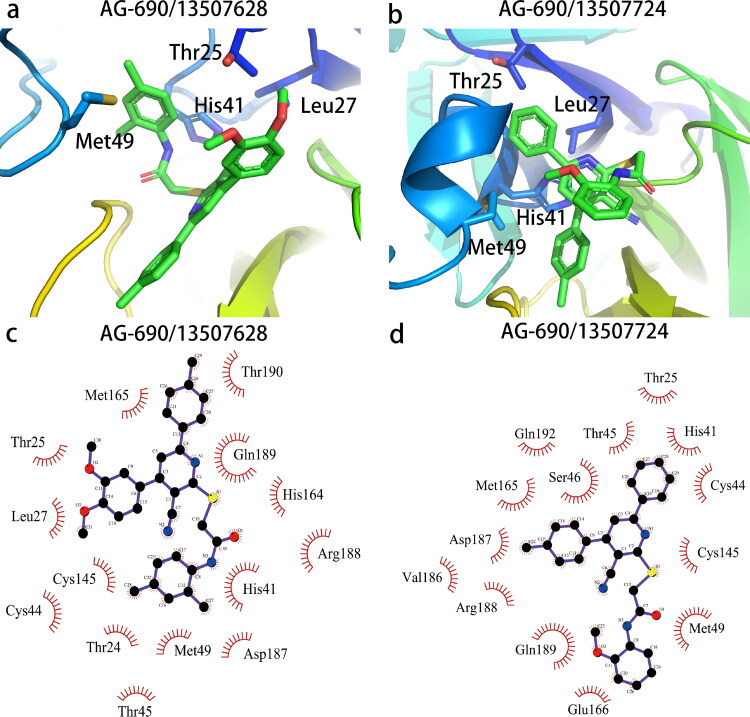
Figure 6.
Interaction diagram of pocket residues (within 4 Å) with two best compounds AG-690/13507628 (a, c) and AG-690/13507724 (b, d). The figure was prepared with PyMol (The PyMOL Molecular Graphics System, Version 2.0 Schrödinger, LLC) and LigPlot (Laskowski & Swindells, 2011).

