
Figure 1: Humoral and cellular immune responses to ChAdOx1 nCoV-19 vaccination in mice.
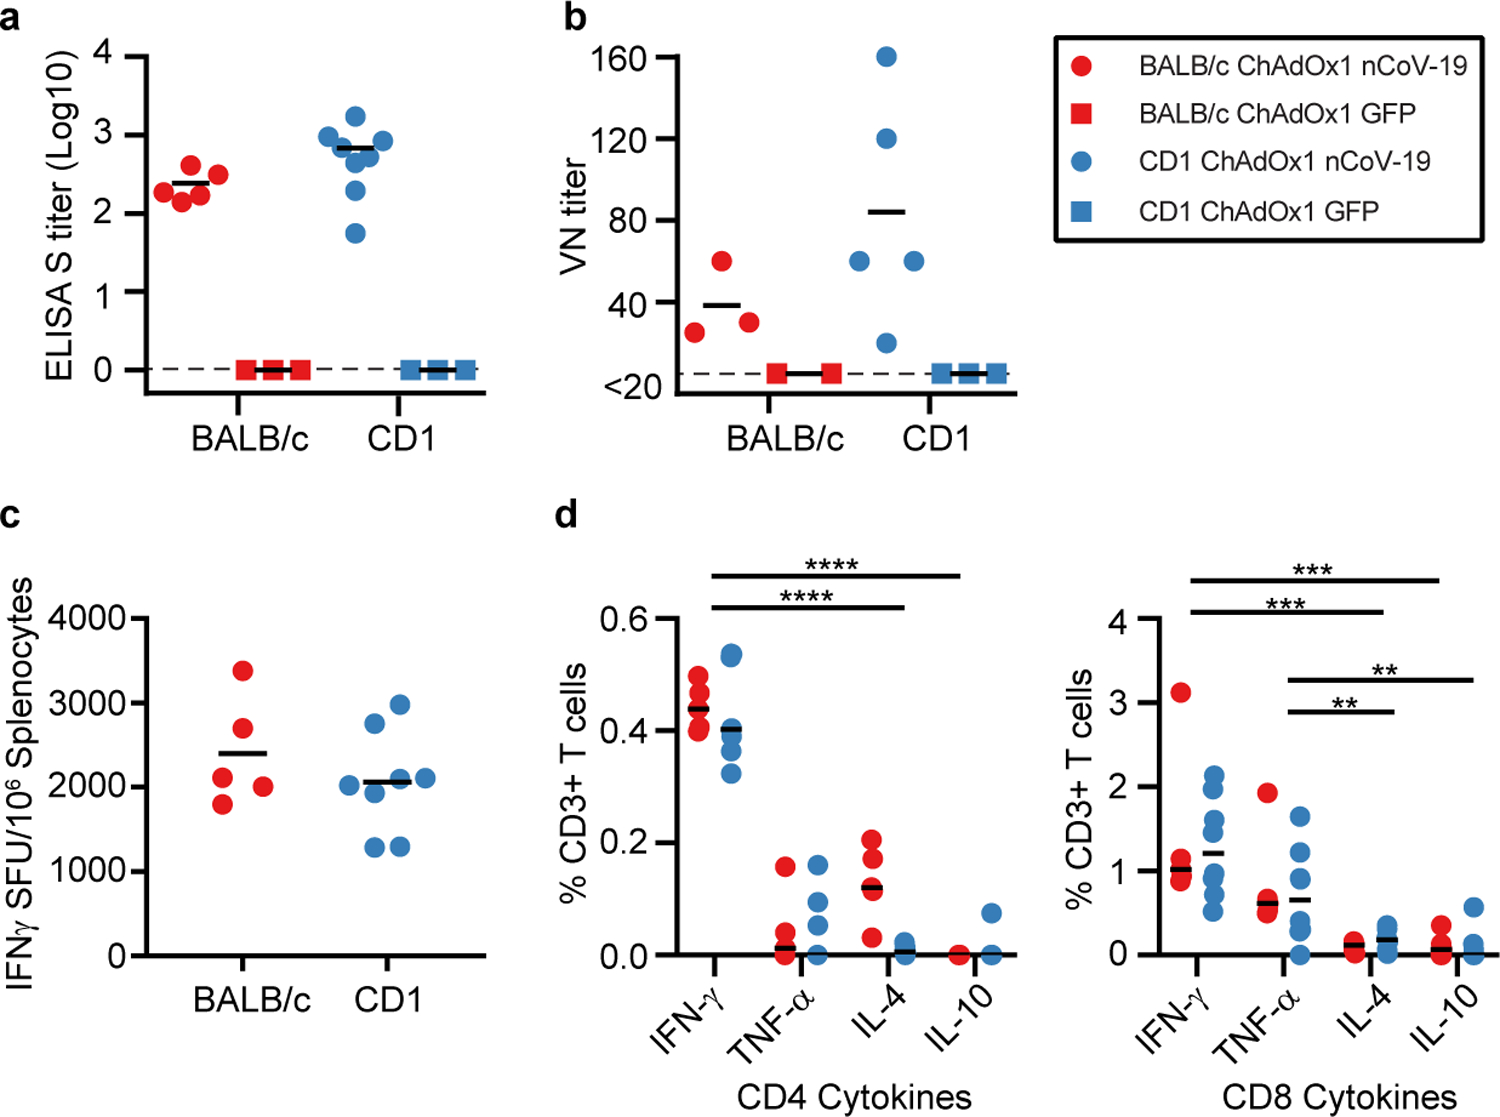
a. End point titer of serum IgG detected against S protein at 14 days post vaccination. No positive responses were detected in the control group. n=5, 3, 8, and 3 animals respectively examined over 1 independent experiment. b. Virus neutralizing titer in serum at 9 days post vaccination. n=3, 2, 5, and 3 animals respectively examined over 1 independent experiment. c. Summed IFN-γ ELISpot responses in splenocytes toward peptides spanning the spike protein at 14 days post vaccination. Control mice had low (<100 SFU) responses. n=5 and 8 animals respectively examined over 1 independent experiment. d. Summed frequency of spike-specific cytokine positive CD3+ T cells at 14 days post vaccination. P-value left panel: <0.0001. P-value right panel 0.0002 (IFN-γ−IL-4); 0.0001 (IFN-γ-IL-10); 0.0054 (TNF-α-IL-4); 0.0022 (TNF-α-IL-10). n=5 and 8 animals respectively examined over 1 independent experiment. BALB/c = red; CD1 = blue; vaccinated = circle; control = square; dotted line = limit of detection; line = mean; SFU = spot-forming units; Spl. = splenocytes; * = p<0.05. Statistical significance determined via 2-way ANOVA (repeated measure) and post-hoc positive test.