
Extended Data Figure 1. Antigen specific responses following ChAdOx1 nCov19 vaccination.
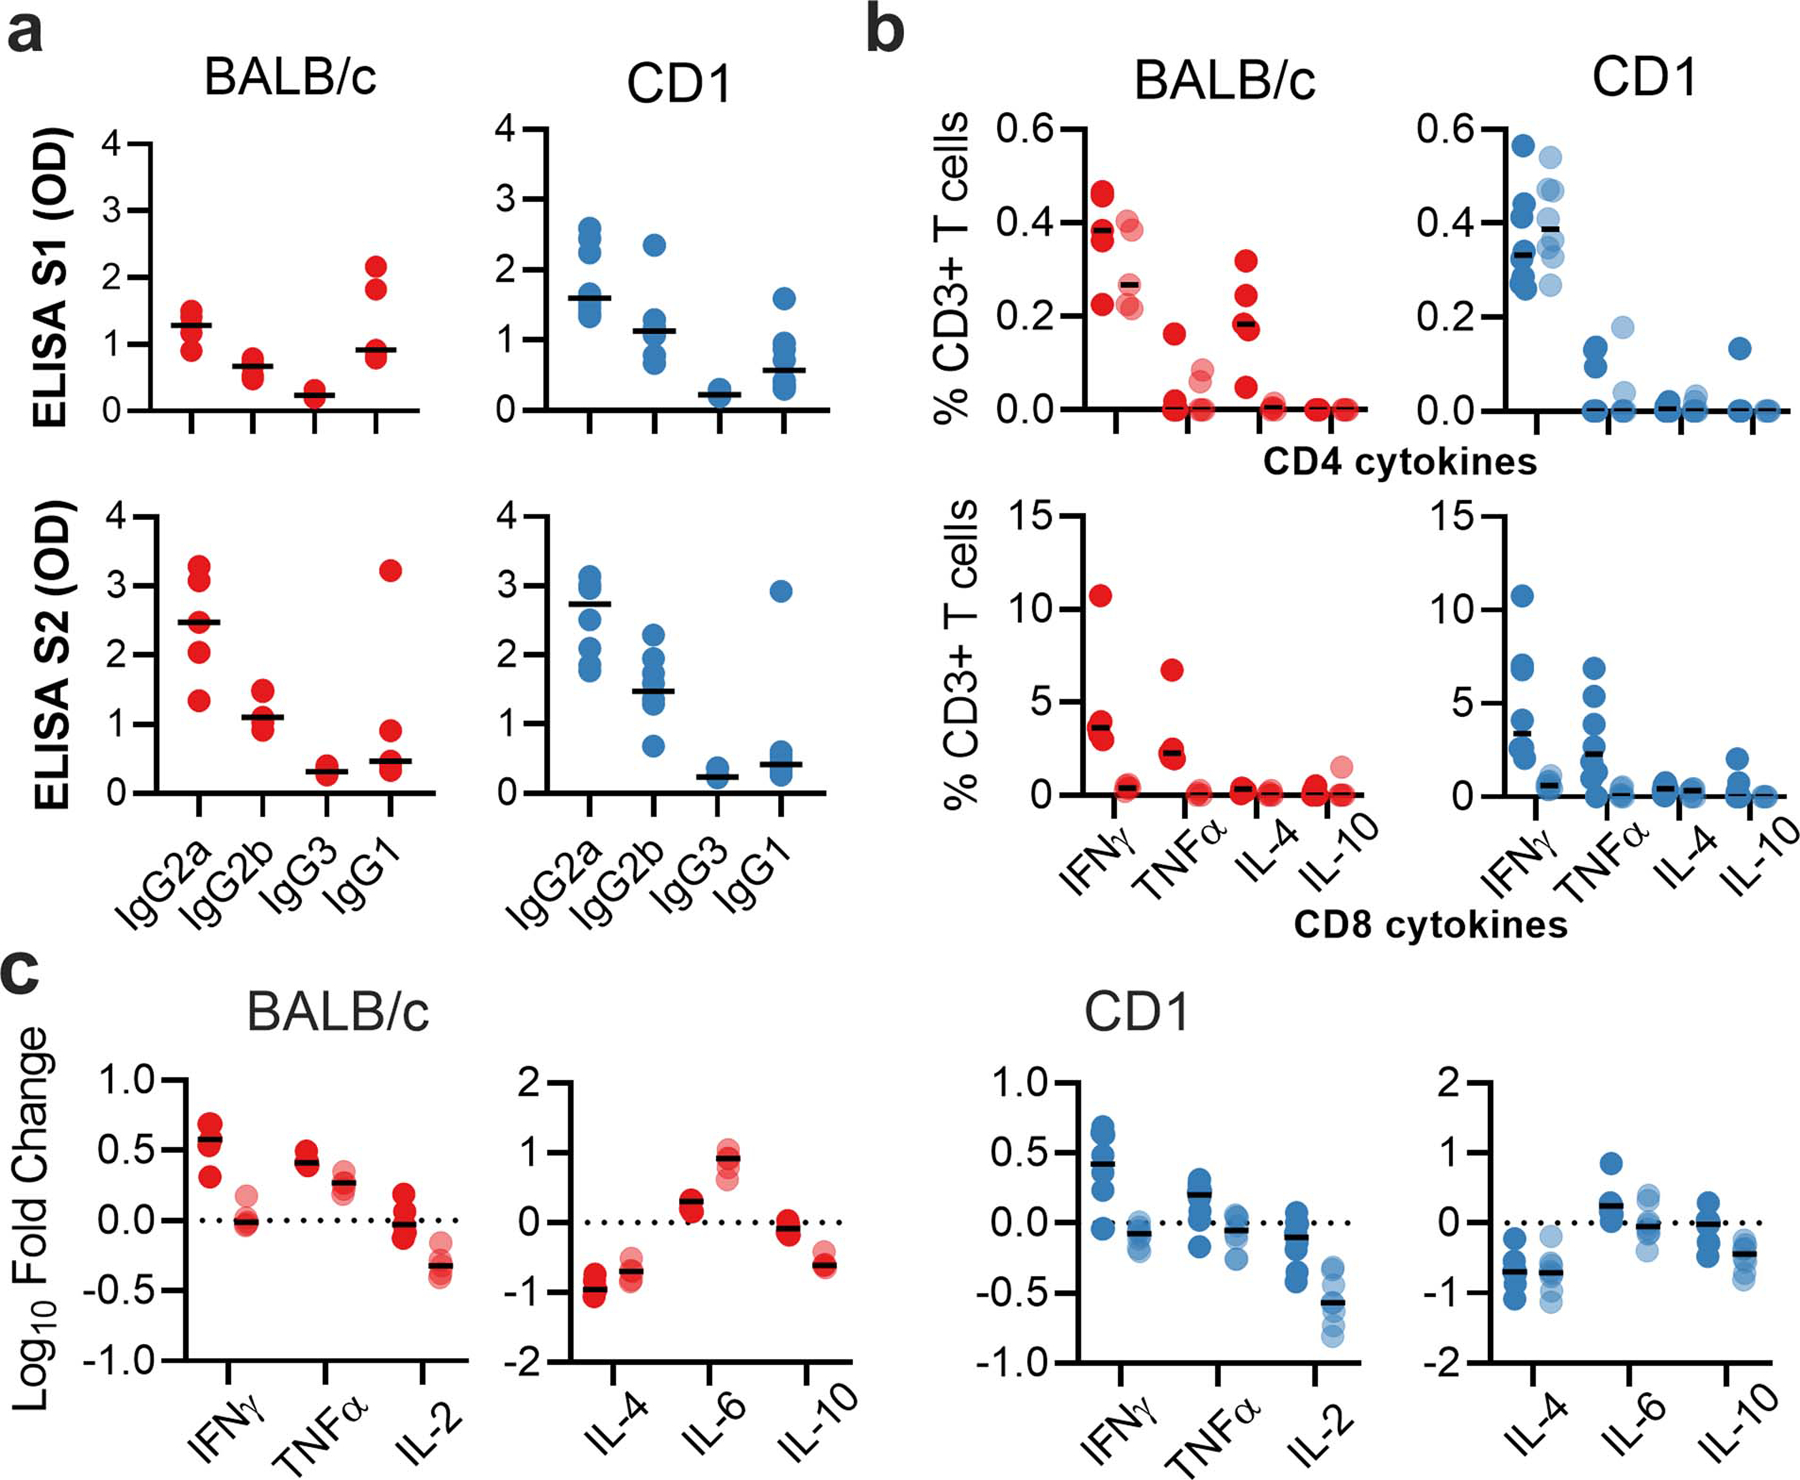
a. IgG subclass antibodies detected against S1 or S2 protein in sera of BALB/c or CD1 mice. b. Frequency of cytokine positive CD3+ T cells following stimulation of splenocytes with S1 pool (dark) or S2 pool (transparent) peptides in BALB/c (red) and CD1 (blue) mice. c. Log10 fold change in cytokine levels in supernatant from S1 (dark) and S2 (transparent) stimulated splenocytes when compared to corresponding unstimulated splenocyte sample for BALB/c and CD1 mice. n=5 (BALB/c) and 8 (CD1) animals examined over 1 independent experiment for all figure panels.