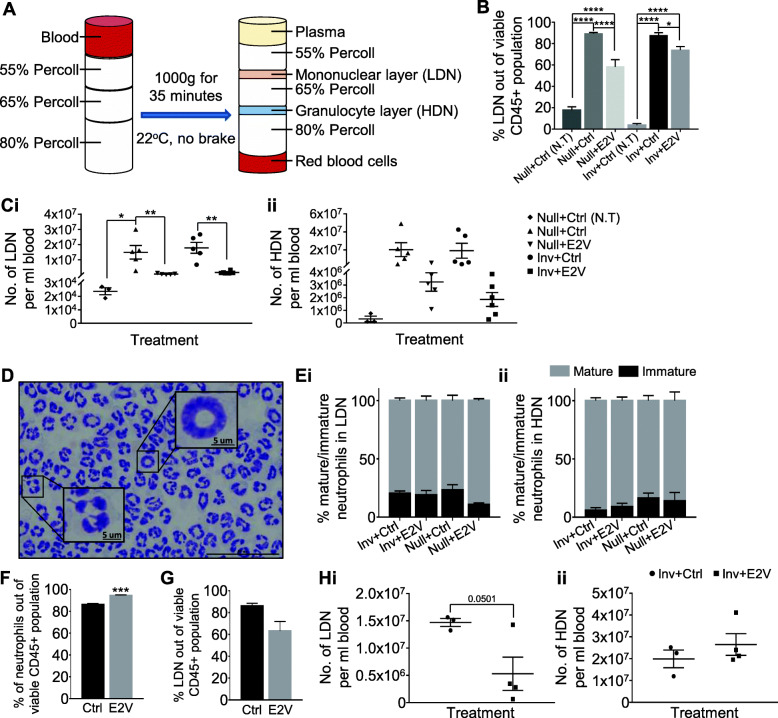
Fig. 3.
Estrogen reduces circulating low-density neutrophils (LDN) in tumour-bearing mice. A, Schematic diagram of the discontinuous Percoll gradient used for the separation of blood into the different cell fractions. B-E, Experiment is conducted according to the description in Fig. 1. B, Percentage of circulating LDN (CD45+CD11b+Ly6G+) out of viable CD45+ population via flow cytometry analysis, Null+Ctrl (N.T) n = 3, Null+Ctrl n = 8, Null+E2V n = 8, Inv + Ctrl (N.T) n = 6, Inv + Ctrl n = 12, Inv + E2V n = 13. C, Estrogen treatment significantly reduces the amount of circulating LDN in tumour-bearing mice while not significantly affecting circulating HDN; (i) Calculated number of circulating LDN per ml blood, (ii) Calculated number of circulating HDN per ml blood. Null+Ctrl (N.T) n = 3, Null+Ctrl n = 5, Null+E2V n = 5, Inv + Ctrl n = 5, Inv + E2V n = 6. D, Representative image of Giemsa stained mature (multilobed nucleus) and immature (banded nucleus) neutrophils. Scale bar: 50um. E, Estrogen treatment in tumour-bearing mice does not affect the proportion of mature and immature neutrophils in circulating LDN; (i) Distribution of circulating LDN displaying banded or multilobed nucleus, (ii) Distribution of circulating HDN displaying banded or multilobed nucleus. Inv + Ctrl n = 7, Inv + E2V n = 7, Null+Ctrl n = 3, Null+E2V n = 3. F-H, At Inv D2, OVX mice were inoculated with 4 T1-Luc2 cells at the 9th abdominal mammary gland. At 48 h prior to sample collection, mice were treated with either E2V or Ctrl. Mice were euthanized and tumour harvested at day 14 post-tumour inoculation. F, Estrogen treatment for 48 h in tumour-bearing Inv mice led to an increased proportion of total circulating neutrophils; Data are expressed as percentage of circulating neutrophils (CD45+CD11b+Ly6G+) out of viable CD45+ population via flow cytometry analysis, Inv + Ctrl n = 3, Inv + E2V n = 4. G, Estrogen treatment for 48 h in tumour-bearing Inv mice resulted in a small reduction in circulating LDN while HDN remain unchanged; Data are expressed as percentage of circulating LDN (CD45+CD11b+Ly6G+) out of viable CD45+ population via flow cytometry analysis, Inv + Ctrl n = 3, Inv + E2V n = 4. H, (i) Number of circulating LDN per ml blood, (ii) Number of circulating HDN per ml blood. Data represented as mean ± SEM. Statistical significances determined using one-way ANOVA followed by post-hoc tukey test in (B) and (C); two-tailed unpaired student’s T-test in (F-H)

