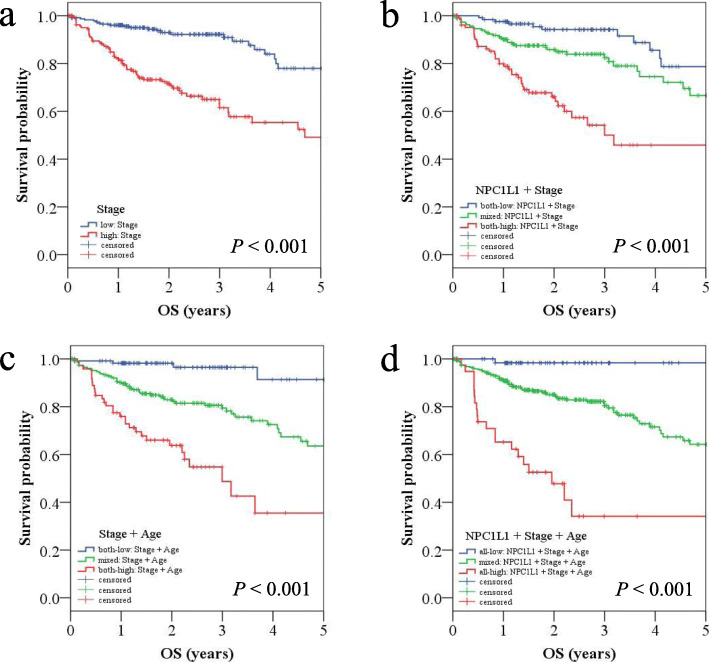
Fig. 4.
Kaplan–Meier survival analysis after applying a combination of prognostic factors. The stage (low: I + II vs. high: III + IV), age (low: < 70 vs. high: ≥ 70), and NPC1L1 (low expression vs. high expression) groups were each divided into two groups. Then, survival analysis was performed by combining prognostic factors. The red line indicates a high stage and/or high NPC1L1 expression and/or older age group. The blue line indicates a low stage and/or low NPC1L1 expression and/or younger age group. The green line indicates mixed combination groups, excluding all high and all low combination groups. a Stage-only group. b NPC1L1 and stage group. c Stage and age group. d NPC1L1, stage, and age group

