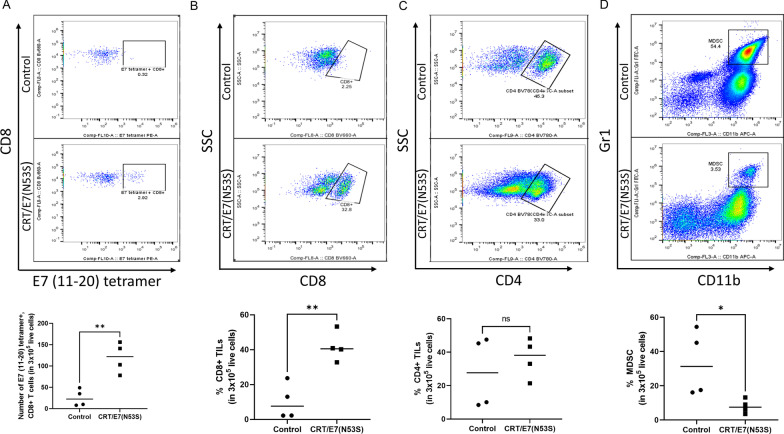
Fig. 6.
Characterization of the tumor microenvironment in spontaneous HPV16-E6E7-expressing oral tumor model in HLA-A2 (AAD) transgenic mice treated with CRT/E7(N53S) DNA vaccine. HPV16-E6E7-expressing oral tumors were induced in HLA-A2 (AAD) mice (4 per group) and treated as described in Fig. 5. One week following the final vaccination, the tumor was surgically extracted for analysis. A Determination of E7(aa11-20) peptide-specific CD8 + T cells using E7 (aa11-20) peptide loaded HLA-A2 tetramer staining followed by flow cytometry analysis. Upper panel is an example of flow cytometry. Bottom panel is vertical scatter plot summarizing the number of E7(aa11-20) peptide-specific CD8 + T cells in the tumor of mice vaccinated with CRT/E7(N53S) or empty vector. B Determination of CD8 + T TILs by flow cytometry analysis. Upper panel is an example of flow cytometry. Bottom panel is the vertical scatter plot summarizing the percent of CD8 + TILs. C Determination of CD4 + TILs followed by flow cytometry analysis. Upper panel is an example of flow cytometry. Bottom panel is the vertical scatter plot summarizing the percent of CD4 + TILs. D Determination of MDSCs by flow cytometry analysis. Upper panel is example of flow cytometry. Bottom panel is the vertical scatter plot summarizing the percent of MDSCs

