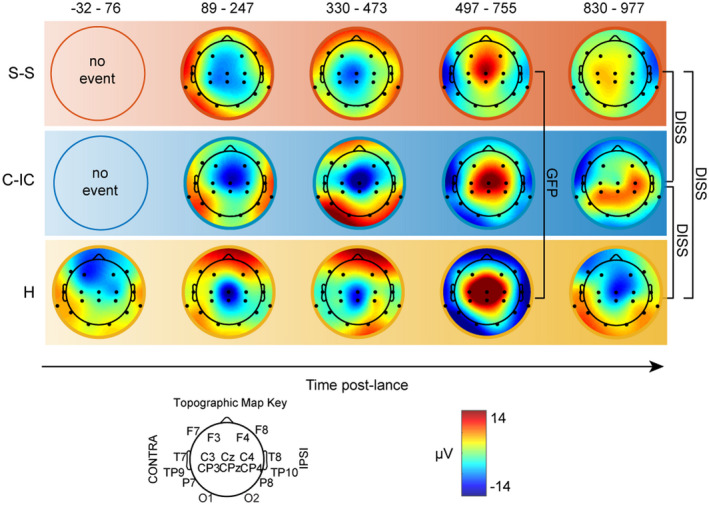
FIGURE 3.

Topographic and magnitude differences of the cortical response to the heel lance according to parental contact. Topographic maps at the latency of peak ERP for each group (Figure 2b). Time windows are based on the topographically consistent events from the grand average and the peak latency for each group fell within this time window. Brackets mark significant differences in topography (DISS) or magnitude (GFP). Skin‐to‐skin (S‐S, red), cot‐individualized care (C‐IC, blue), held with clothing (H, yellow)
