
FIGURE 5.
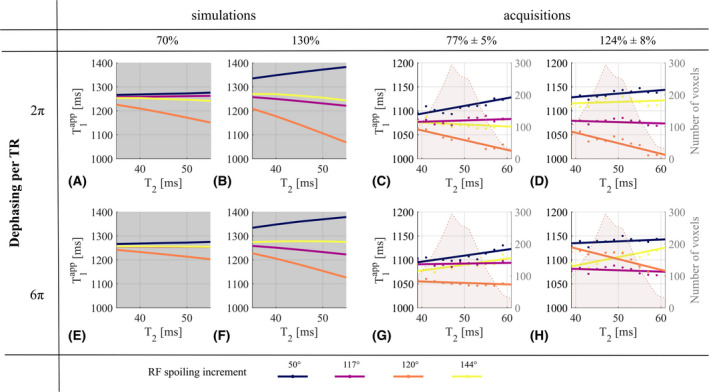
In vivo, obtained with , as a function of T2. Dephasing across a voxel of 2π (A‐D) and 6π (E‐H) per TR are shown. Original (×1) (A,C,E,G) and high (×1.6) (B,D,F,H) transmitter reference voltage are shown. A,B,E,F, Numerical simulations. Fixed parameters are: T1 = 1250 ms, D = 0.8 µm2/ms, , and 130% as measured in the transmit field map in the slice of interest. C,D,G,H, Acquisitions, and linear fitting for illustration purposes. The number of voxels included in each bin is depicted by the shaded background of each graph for each ϕ0