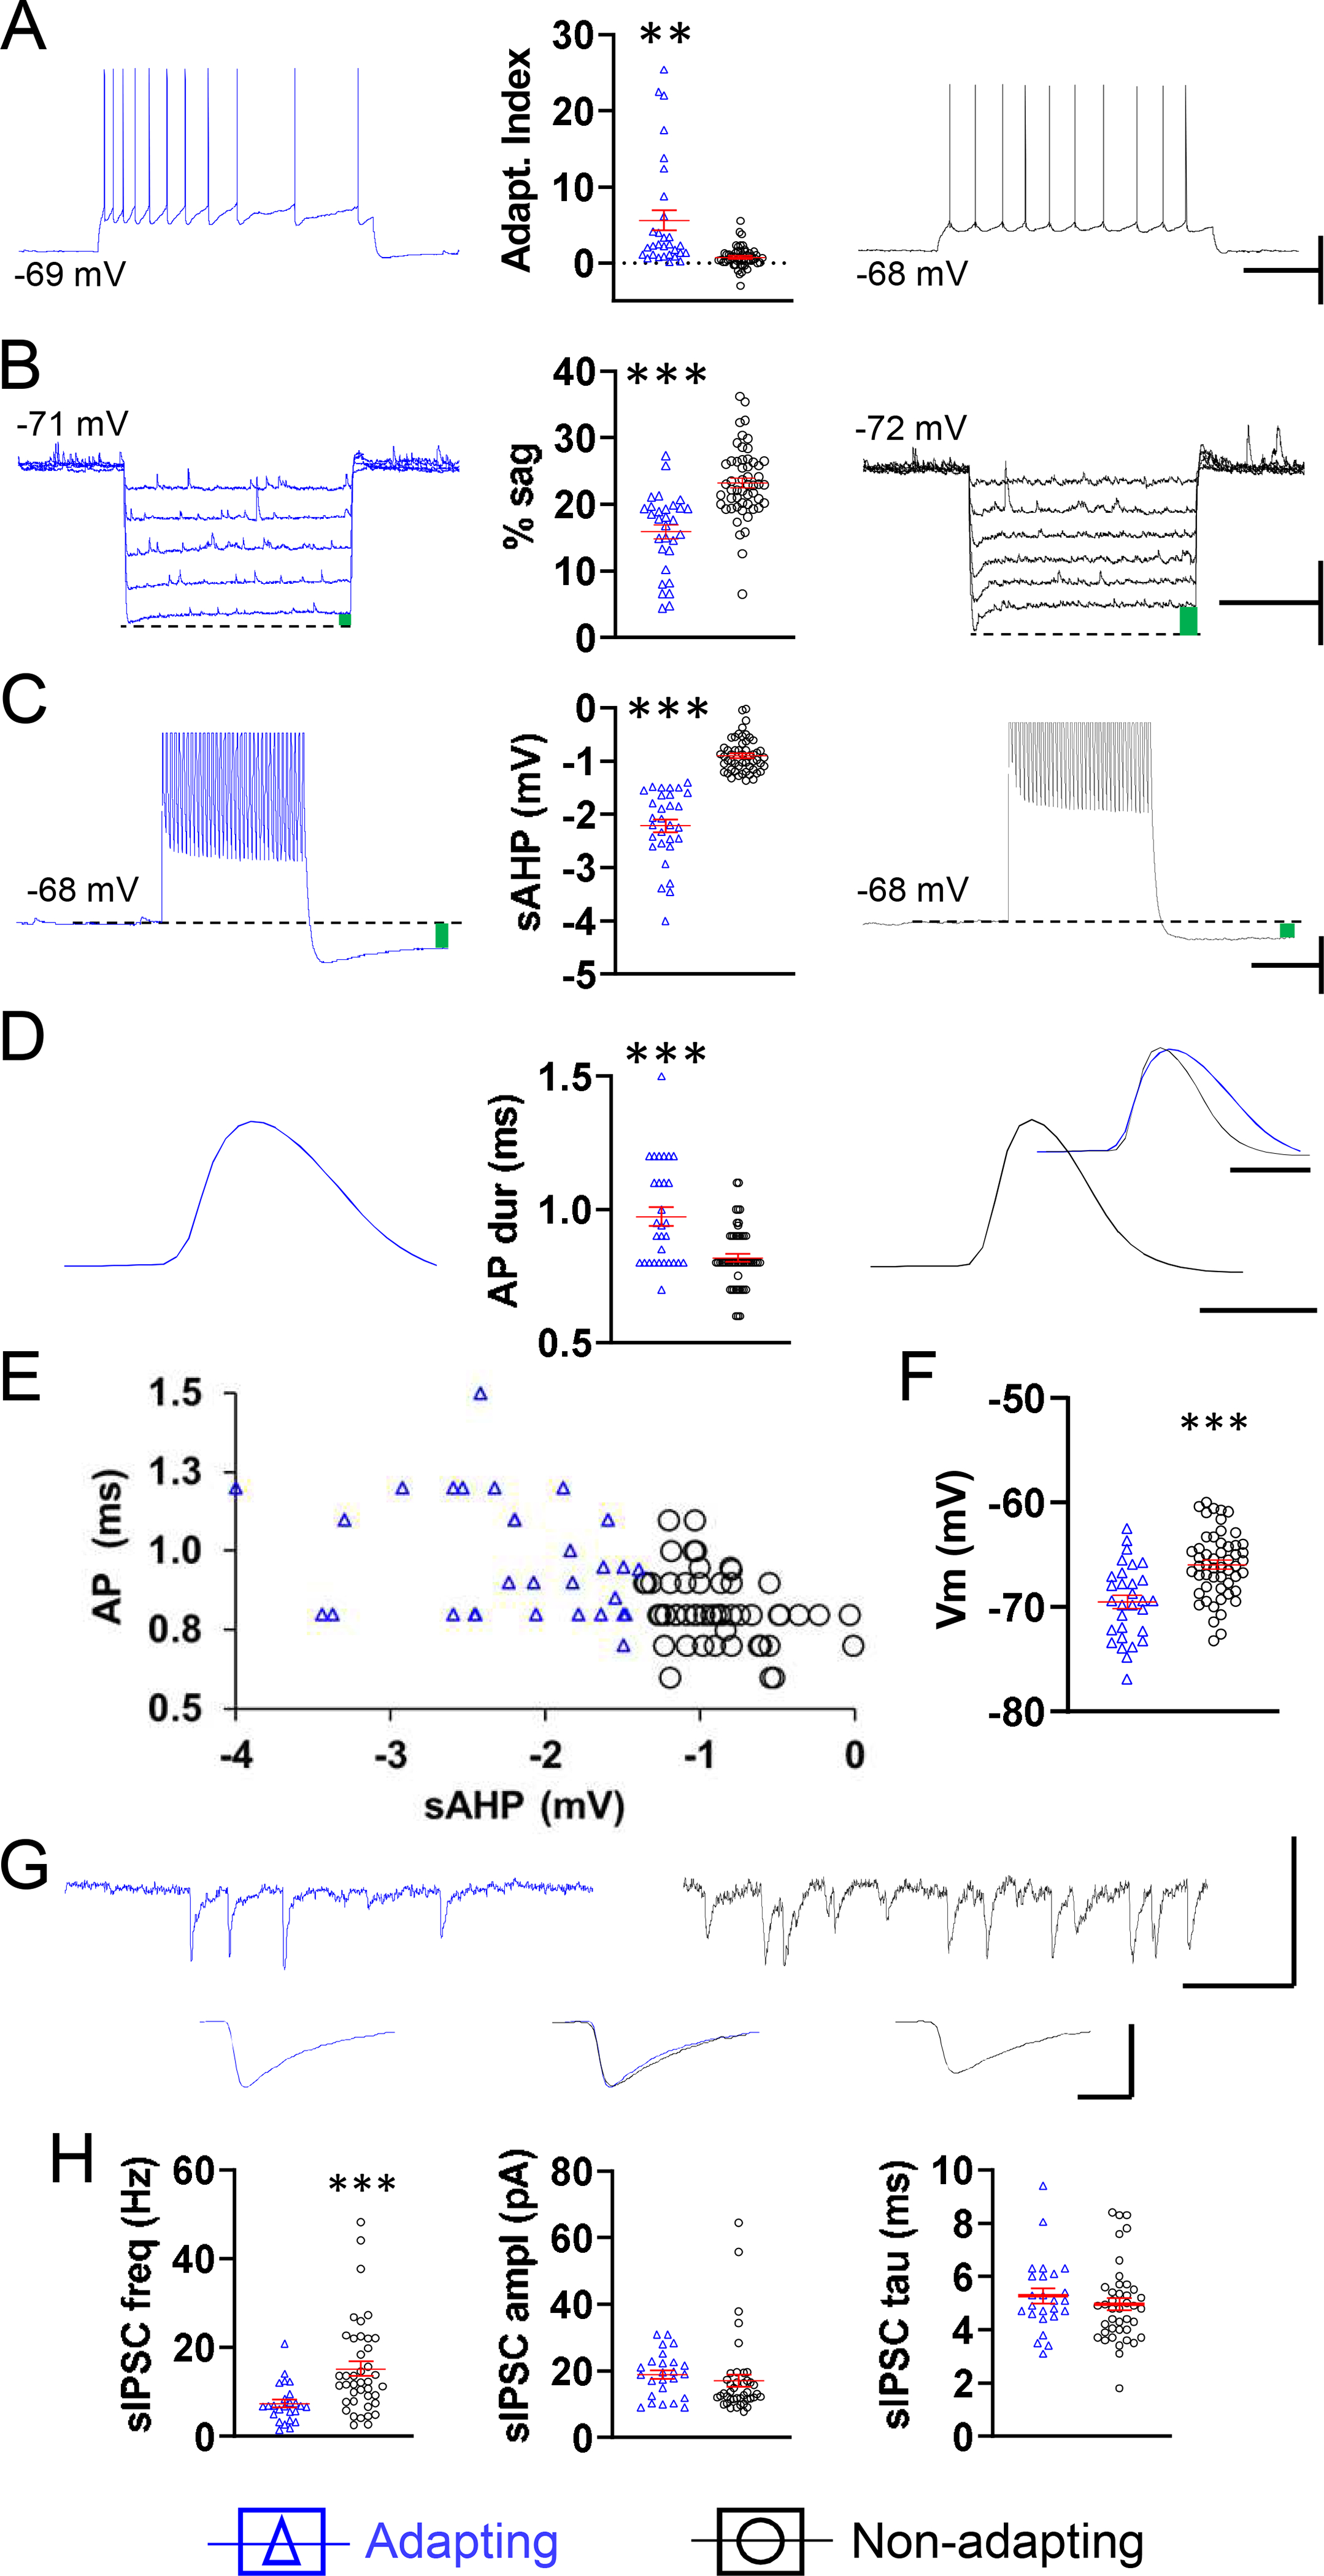
Fig. 2.

The two populations of L5 pyramidal neurons determined by cluster analysis, adapting and non-adapting, have contrasting intrinsic properties and different IPSC frequencies. Representative examples of spike frequency adaptation (A), sag, indicated by green bar (B), sAHP, average of 5 traces, indicated by green bar (C), and spike duration, average of 3 traces, scaled for amplitude (D), all from one neuron in the adapting group (left, blue) and all from one neuron in the non-adapting group (right, black). Respective summary graphs are found between traces. (E) Plot of AP duration at half-amplitude as a function of sAHP illustrating the clustering of neurons into a group with longer duration APs and larger sAHP (blue triangles) and a group with shorter duration APs and smaller sAHP (black circles). (F) Summary graph of resting membrane potential for neurons in the adapting and non-adapting groups. (G) Top, representative traces illustrating the sIPSC frequency and amplitude in the neuron from the adapting group (left, blue) and the neuron from the non-adapting group (right, black). Below, averaged traces of 50 consecutive, non-summating sIPSCs from each of the two cells above. Below, middle, the flanking traces were amplitude-scaled and superimposed in order to compare kinetics. (H) Respective summary graphs of sIPSC frequency, amplitude, and decay time (tau). A-F, n = 30 adapting cells from 25 mice (left), 53 non-adapting cells from 40 mice (right). H, n = 25 adapting cells from 20 mice (left), 41 non-adapting cells from 36 mice (right). Of ten GFP+ neurons recorded, one belonged to the adapting category, nine to the non-adapting category. Horizontal lines with error bars in scatter plots indicate the mean and SE. ** p < 0.01, *** p < 0.001. Scale bars. A: 40 mV, 500 ms. B: 10 mV, 1 s. C: 10 mV, 250 ms. D: 1 ms. G: top 50 pA, 100 ms, bottom, 20 pA, 2 ms.
