
Fig. 4.
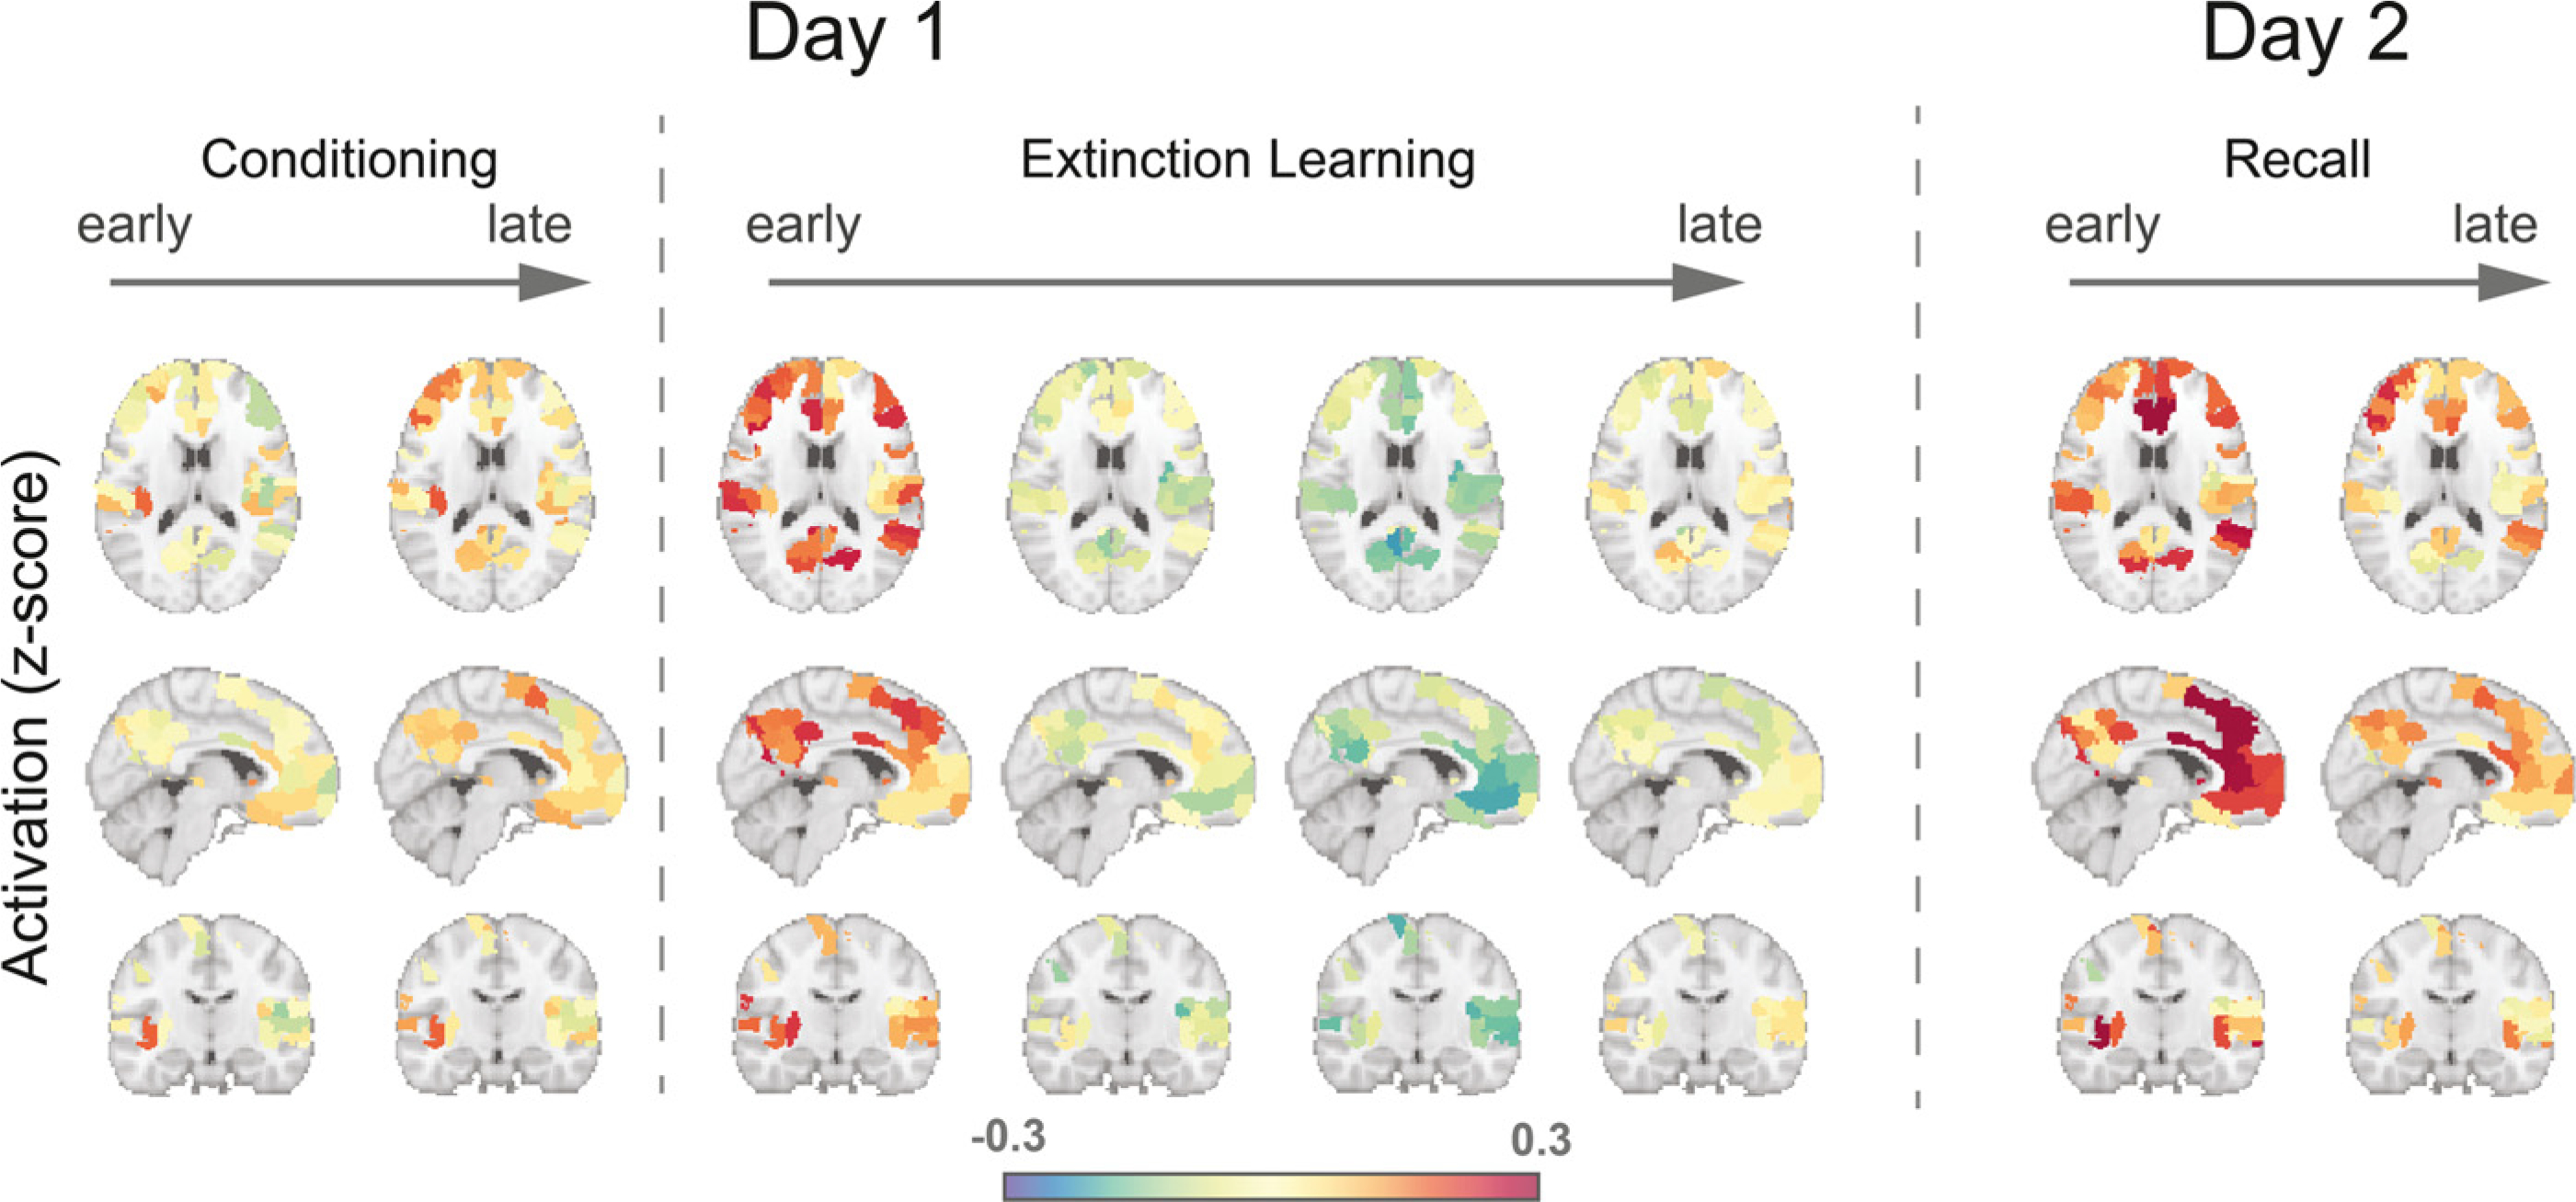
Brain activation patterns across experimental phases. In day 1, brain maps represent regional activation differences between CS+ and CS-. In day 2, brain maps represent regional activation differences between CS+E and CS-. Only regions exhibited significant connectivity differences during late extinction learning were shown.