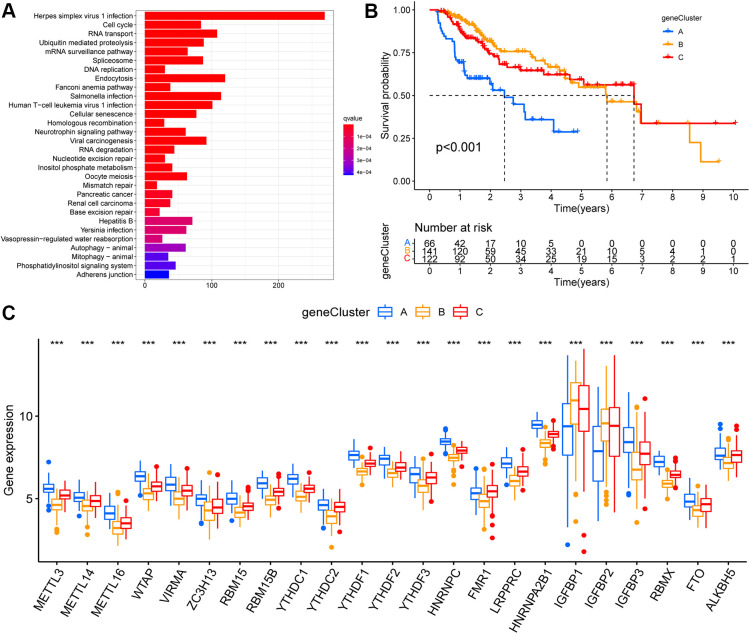
Figure 3.
Identification of m6A modification genomic phenotypes in hepatocellular carcinoma. (A) Biological pathway of differentially expressed genes (DEGs) for the m6A modification patterns. (B) The overall survival of m6A modification genomic phenotypes using Kaplan–Meier curves. (C) The gene expression levels of 23 m6A regulators in three m6A modification genomic phenotypes (*, P < 0.05; **, P < 0.01; ***, P < 0.001; ns, no significant; Kruskal–Wallis test).

