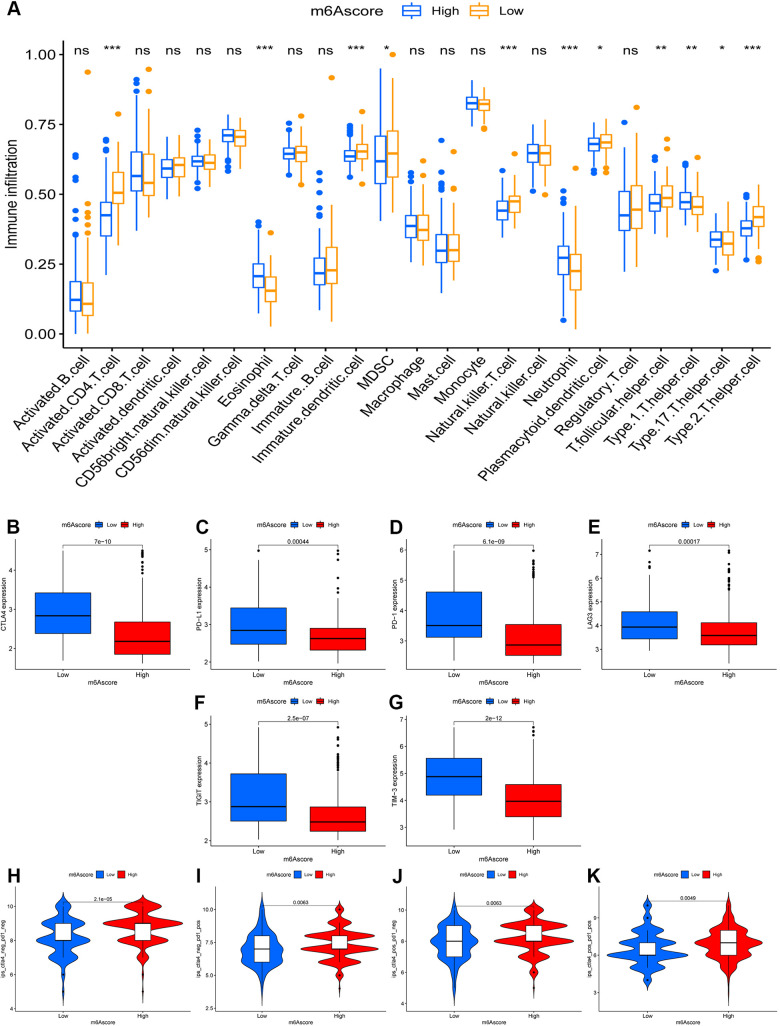
Figure 5.
The role of m6A-scoring signature in immunotherapy. (A) Differences in immune cell infiltration of m6A-scoring signature (*, P < 0.05; **, P < 0.01; ***, P < 0.001; ns, no significant). (B–G) Expression of immune checkpoints among low and high m6A score groups. Immune checkpoints including CTLA4 (B), PD-L1 (C), PD-1 (D), LAG3 (E), TIGIT (F), TIM-3 (G). (H–K) The relative distribution of immunophenoscore (IPS) was also compared between low and high m6A score groups.

