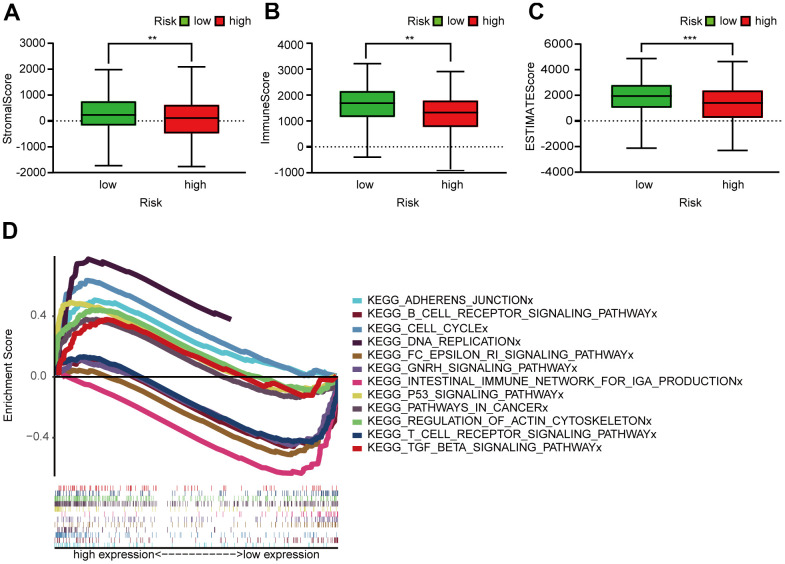
Figure 6.
Assessment of TME and GSEA of high- and low-risk patients. (A–C) Column diagrams show that the high-risk group had significantly lower StromalScore (A), ImmuneScore (B), and ESTIMATEScore (C) than the low-risk group. (D) GSEA results reveal that intestinal immune network for IgA production and the T and B cell receptor signaling pathway were enriched in the low-risk groups. In the high-risk groups, cell cycle, P53 signaling, DNA replication, adherens junction, actin cytoskeleton regulation, pathways in cancer, and TGF-β signaling pathways were active relatively.

