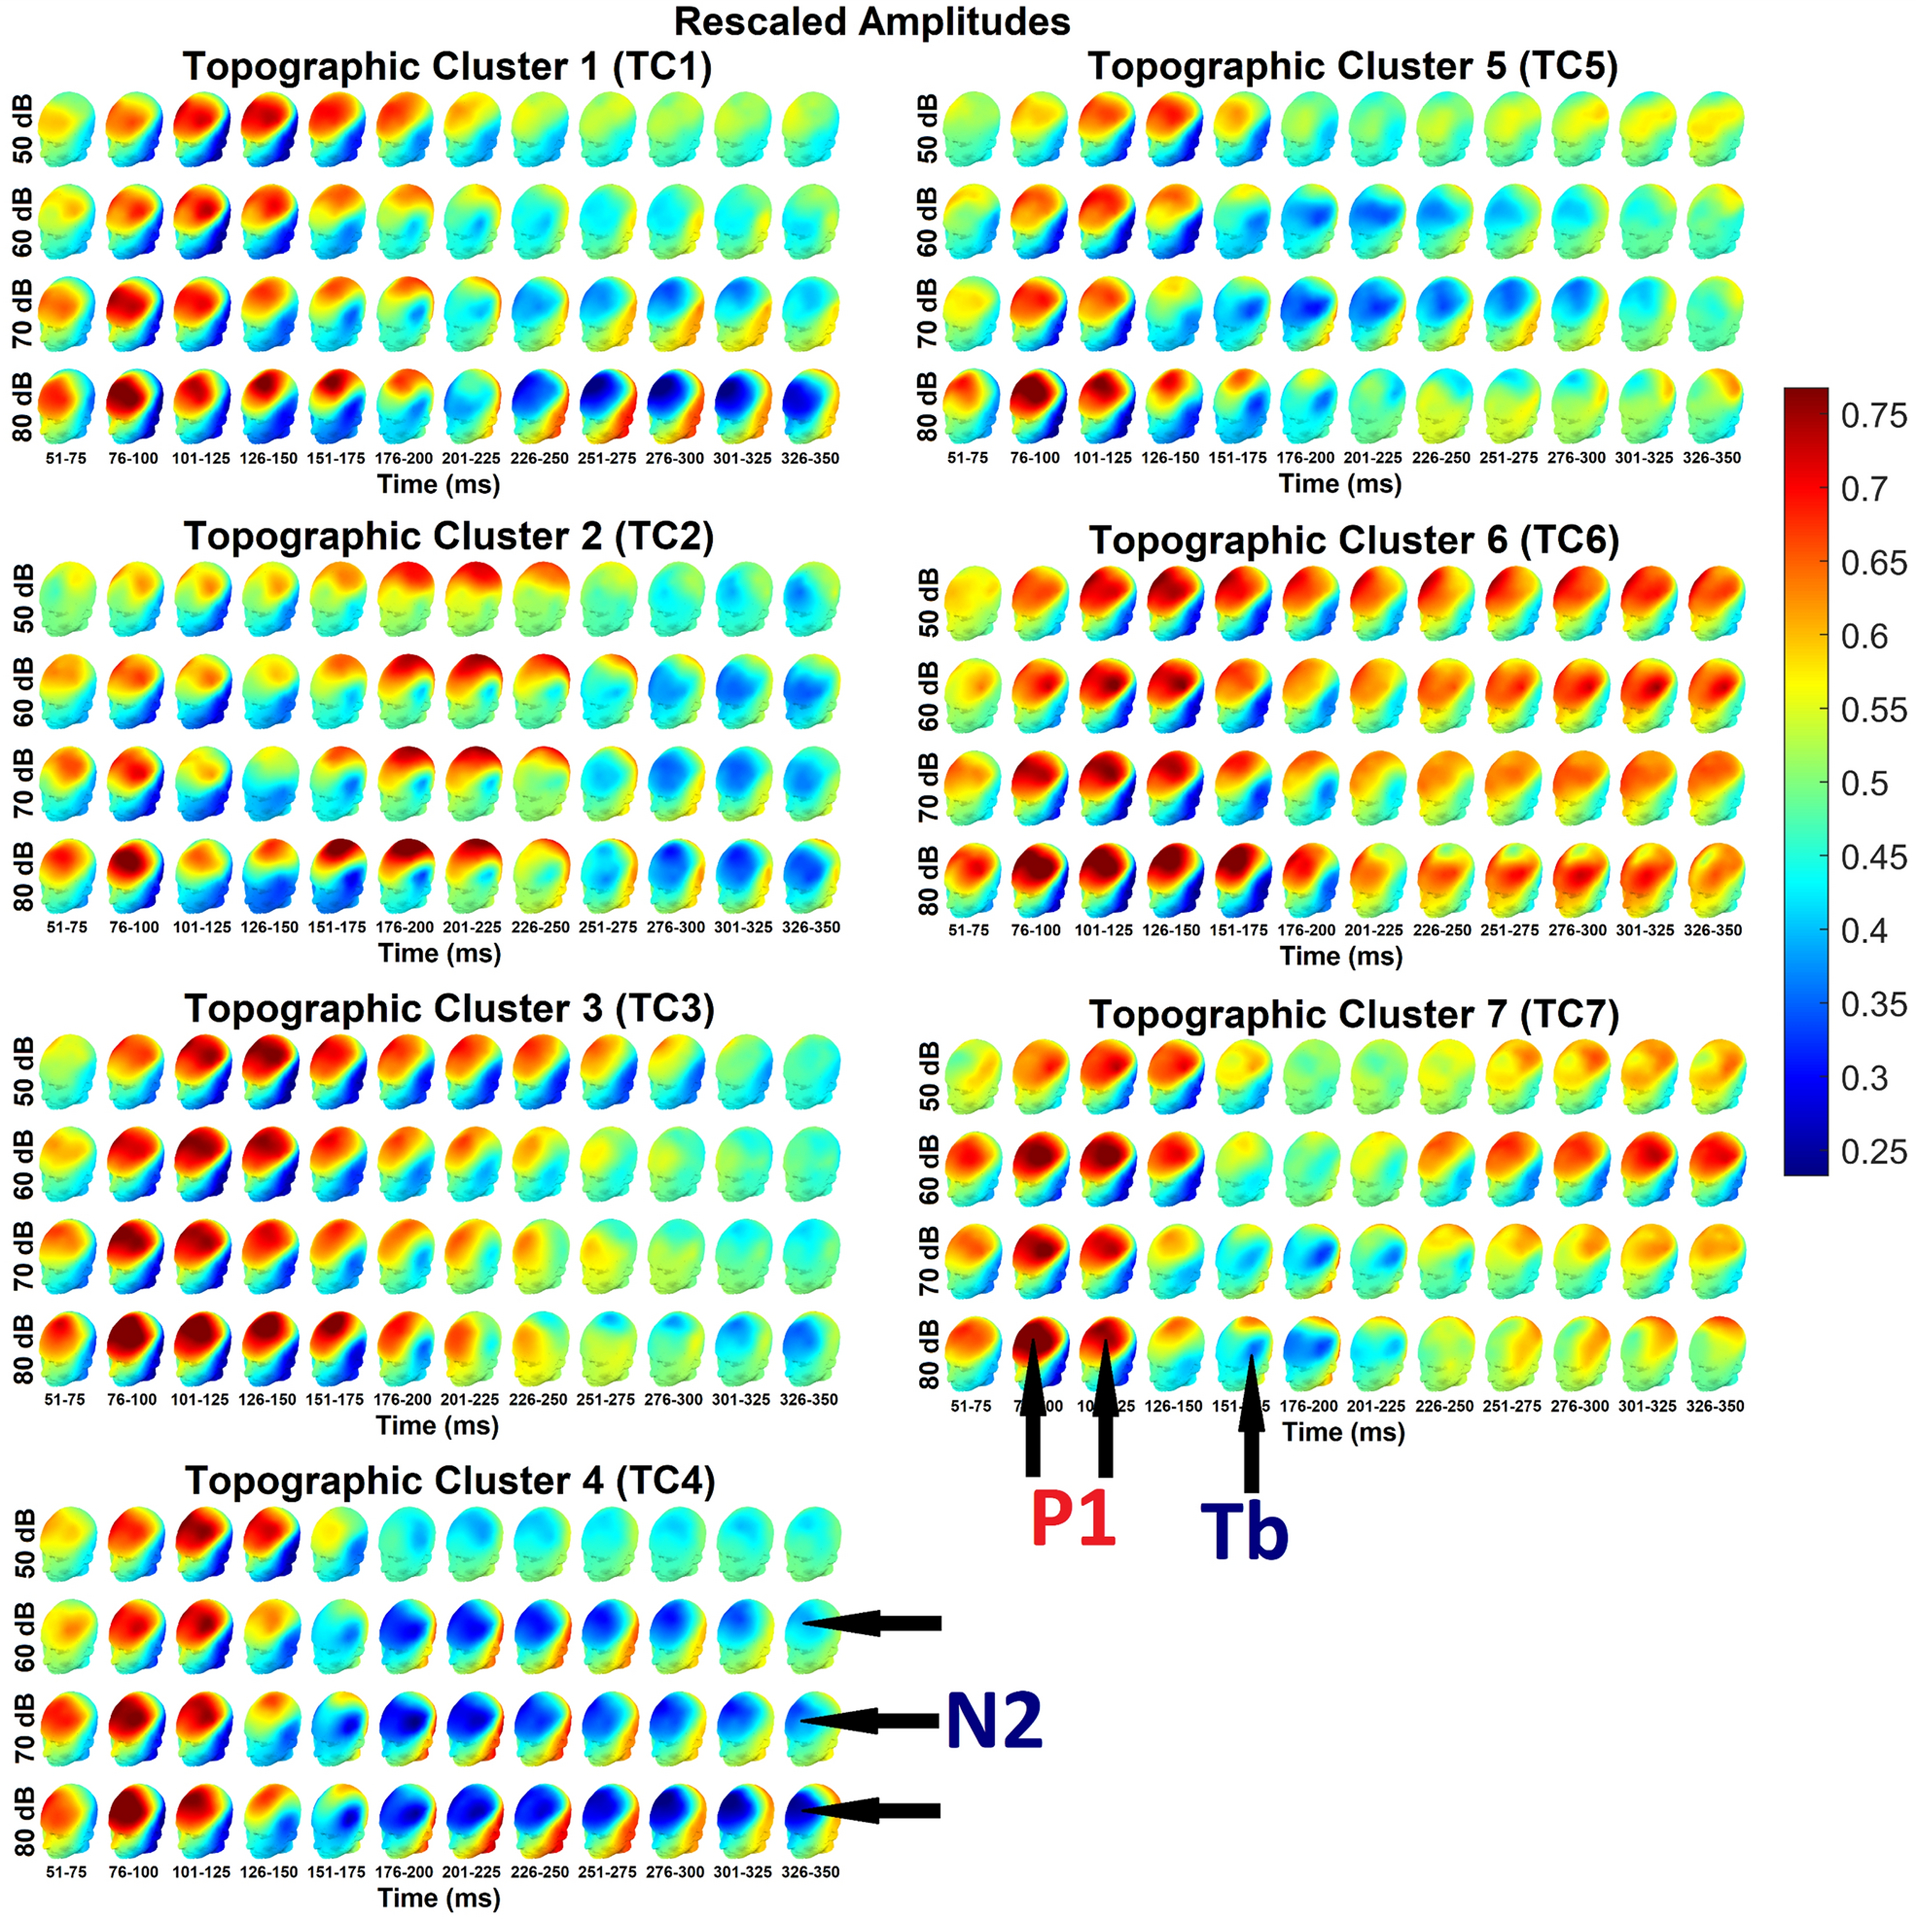
Fig. 3.

ERP amplitudes, rescaled within participants and time-points to range between 0 and 1 across conditions and channels, averaged across each cluster and intensity, collapsed across diagnostic groups, spherically splined from 61 channels and plotted on a head model, in consecutive 25 ms time windows from 51– 350 ms. All clusters appear to display frontocentral P1 responses around ~76–175 ms, though with lower amplitude in TC2. Interestingly, in TC6, the frontal P1 response appears extremely prolonged, with high rescaled voltages being visible across all time windows and intensities from ~76–350 ms. TC7 also displays late high frontocentral rescaled amplitudes, but these only become visible after ~225 ms and are less visible in the 80 dB condition. In TC2, the P1 appears to be followed by a second period of high rescaled amplitudes over central sites around ~176–250 ms (i.e., a central positivity, as demonstrated by raw amplitudes topographies in Fig. 4); a prolongation of the P1 can be observed in TC3 up to as late as ~251–275 ms. Frontocentral N2 responses are visible in TC1, TC2, TC3, TC4, and TC5, and to some extent TC3, but onset latencies vary substantially from around ~176–200 ms (TC4) to ~301–325 ms (TC3). Some suggestion of an N2 is visible in TC7 (~176–200 ms), though this might be better interpreted as a Tb response. The N2 is generally evoked mainly in response to high-intensity 70 dB and 80 dB sounds, but clear N2 responses to soft 60 dB sounds are visible in TC2, TC4, and TC5. Strangely, there is little evidence of an N2 response to high-intensity 80 dB sounds in TC5.
