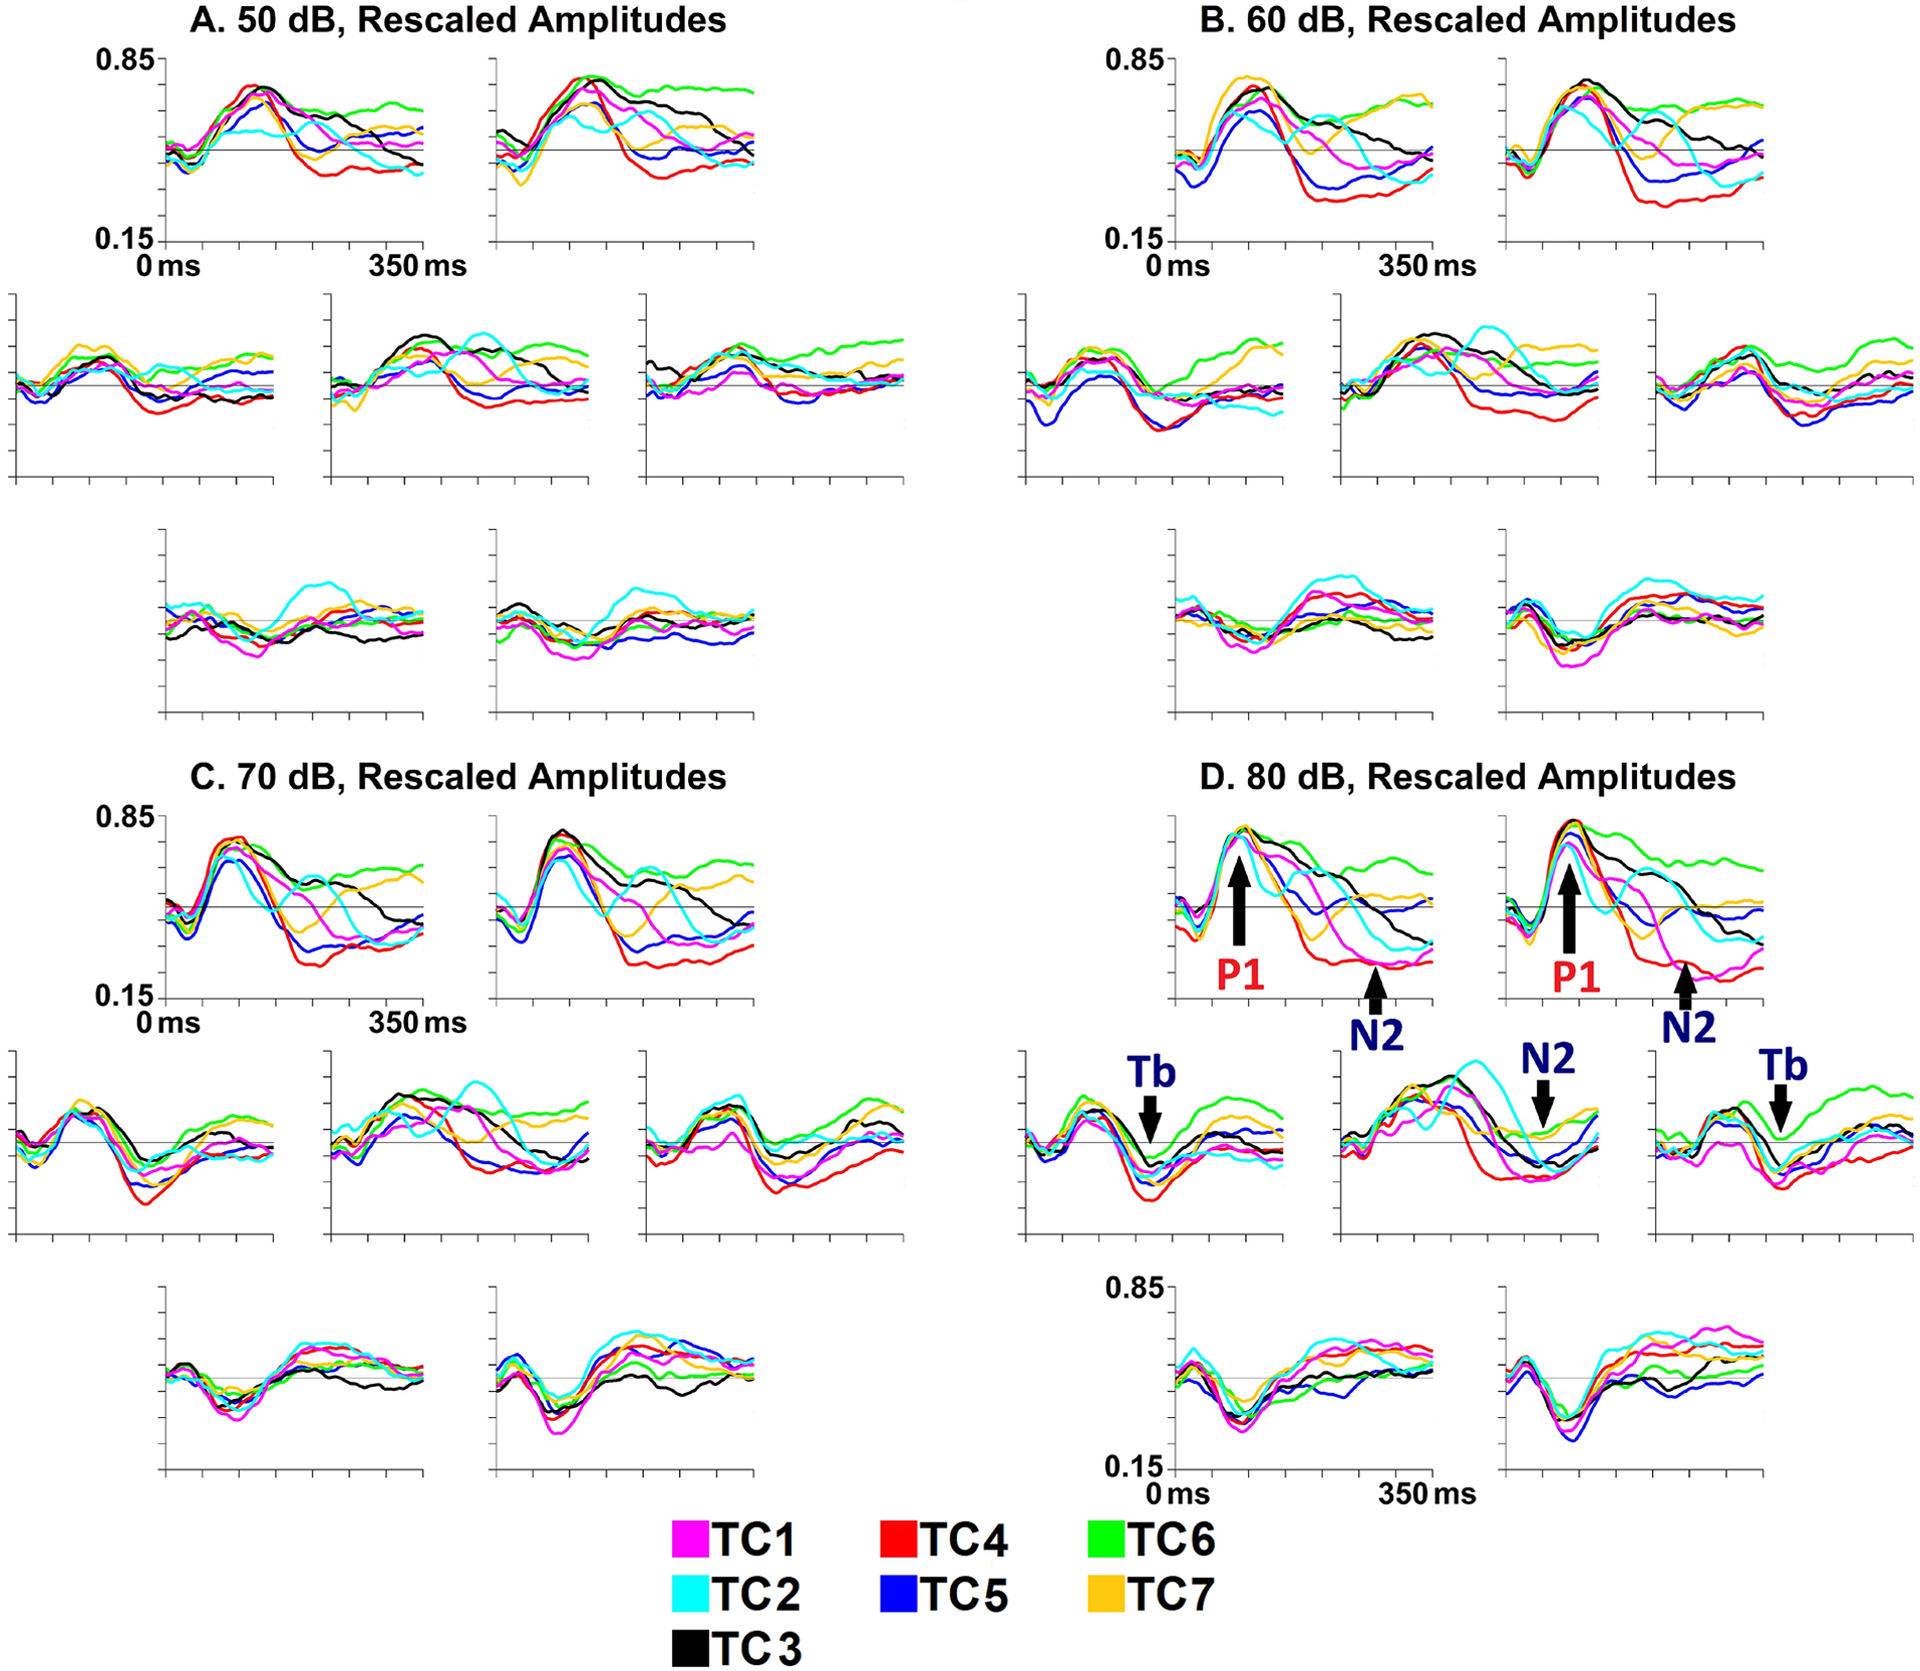
Fig. 4.

ERP amplitude waveforms over electrodes in each of the seven regions depicted in Fig. 1, rescaled within participants and time-points to range between 0 and 1 across conditions and channels, averaged across each cluster from the seven-cluster solution, collapsed across diagnostic groups. The Y-axis (vertical line on each subplot) ranges from 0.15 to 0.85, with tick marks for every 0.10 rescaled amplitude units. The X-axis ranges from 0 to 350 ms, with tick marks each 50 ms.
A (top left). Rescaled amplitude waveforms evoked by 50 dB stimuli. All clusters appear to display frontocentral P1 responses. Interestingly, TC6 displays continuous high rescaled amplitudes (suggestive of positive raw voltages) frontally, perhaps suggestive of a very prolonged P1 response. In TC2, the P1 is followed by a second period of high rescaled amplitudes (suggestive of a positivity) over the central region, and to a lesser extent frontally. The central P1 appears somewhat prolonged in TC1 and TC3. It is difficult to discern any clear N2 response in this condition, but frontocentral rescaled amplitudes appear particularly low in TC4.
B (top right). Rescaled amplitude waveforms evoked by 60 dB stimuli. In TC7, a period of low rescaled frontal amplitudes (i.e., a negativity, perhaps an early N2) following the P1 terminates early and appears to be followed by a frontocentral positivity. As in the 50 dB condition, a prolonged frontal positivity is visible in TC6. A second positivity following P1 appears evident in TC2, while the P1 appears prolonged in TC1 and TC3. The temporal Tb response appears to be visible in some clusters, especially TC1, TC4, TC6, and TC7. In comparison to the 50 dB condition, the N2 response appears more distinct in some clusters. Frontocentral N2 responses seem evident in TC4 and TC5, and a later N2 is visible frontally in TC2; rescaled amplitudes also appear somewhat low frontally in TC1 and centrally in TC3.
C (bottom left). Rescaled amplitude waveforms evoked by 70 dB stimuli. A prolonged fronto-central positivity appears to be visible in TC6. A second positivity following P1 appears evident in TC2, while the P1 seems prolonged in TC1 and TC3. Particularly robust and sustained frontocentral N2 responses are evident in TC1, TC4, and TC5, while the N2 response appears somewhat later in TC2 and TC3. As in the 60 dB condition, there is an early frontal negativity in TC7, followed by little further activity.
D (bottom right). Rescaled amplitude waveforms evoked by 80 dB stimuli. Patterns are generally similar to those from the 70 dB condition, with some exceptions. The prolonged positivity in TC6 is visible frontally but, compared to the 70 dB condition, is less evident over the central region. In TC5, the N2 appears primarily over the central region; in contrast to the 70 dB condition, there is little evidence of an N2 response to 80 dB stimuli over frontal regions in TC5.
