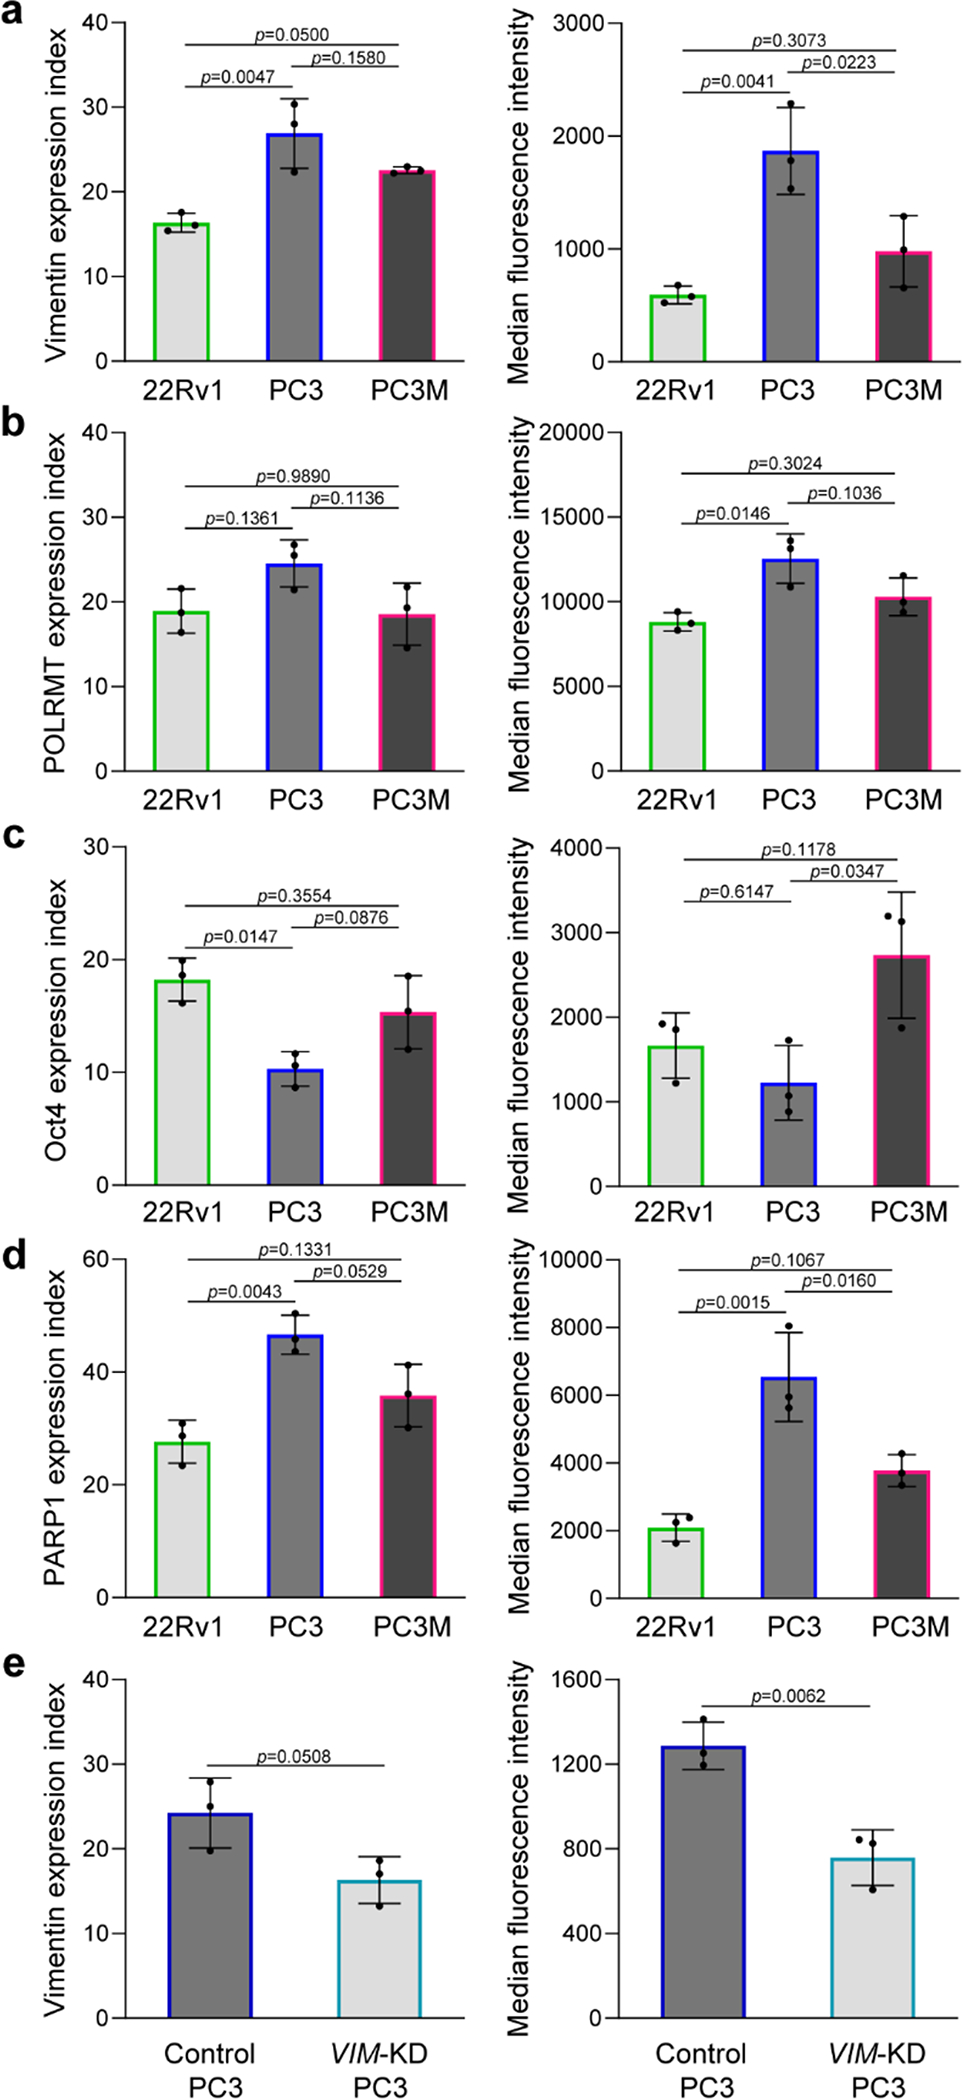
Fig. 3 |. Analysis of clinically-relevant intracellular proteins.

a–d, Cellular analysis of four intracellular proteins, including (a), vimentin, (b), POLRMT, (c), Oct4, and (d), PARP1 in three prostate cancer cell lines using the single-cell approach (left graphs) and flow cytometry (right graphs). A total of 100 cells and 100,000 cells were used for the single-cell analysis and flow cytometry trials, respectively. The agreement between the intracellular protein expression indices determined using the single-cell approach and flow cytometry indicates that the method is quantitative. Error bars represent the s.d. of biological replicates (N=3). Ordinary one-way ANOVA tests were used to analyse the data and Turkey’s corrections with 95% confidence intervals and significance were used. e, Analysis of vimentin in PC3 cells after knocking down the VIM gene using the single-cell approach (left graph) and flow cytometry (right graph). Error bars represent the s.d. of biological replicates (N=3). Unpaired two-tailed Student’s t-test was used to the analyse the data.
