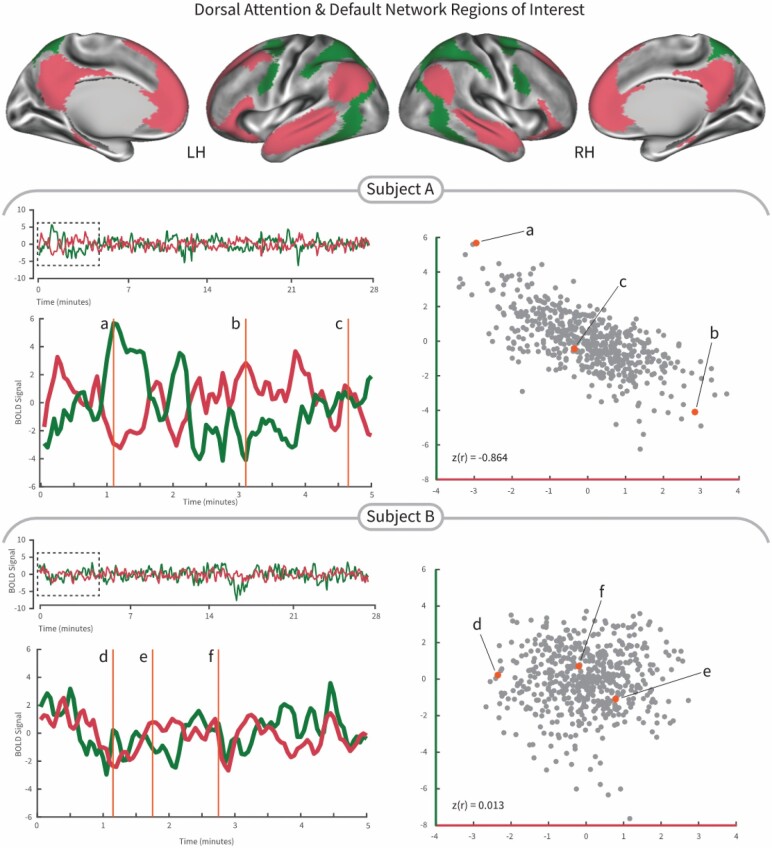
Figure 1.
Demonstration of the interaction between the dorsal attention network (green color) and the default network (crimson color) from two subjects in the Parkinson’s cohort. Subject A exhibited relatively strong negative correlation between the dorsal attention network and the default network, that is, the correlation value between 2 networks was −0.864 and the stride time variability was low (1.98%). We selected 3 time points in the fluctuation of the BOLD signal time series to highlight time points with high dorsal attention network and low default network (a), equal dorsal attention and default networks (b), and low dorsal attention network and high default network (c) activity illustrating the connectivity correlation. Subject B exhibited relatively weak correlation strength between activity of the dorsal attention network and the default network, that is, the correlation value between two networks was 0.013 and the stride time variability was high (3.87%). We selected 3 time points (d–f) in the fluctuation of the BOLD signal time series to highlight how similar time epochs do not differentiate the default and dorsal attention networks activity. LH = left hemisphere; RH = right hemisphere.

