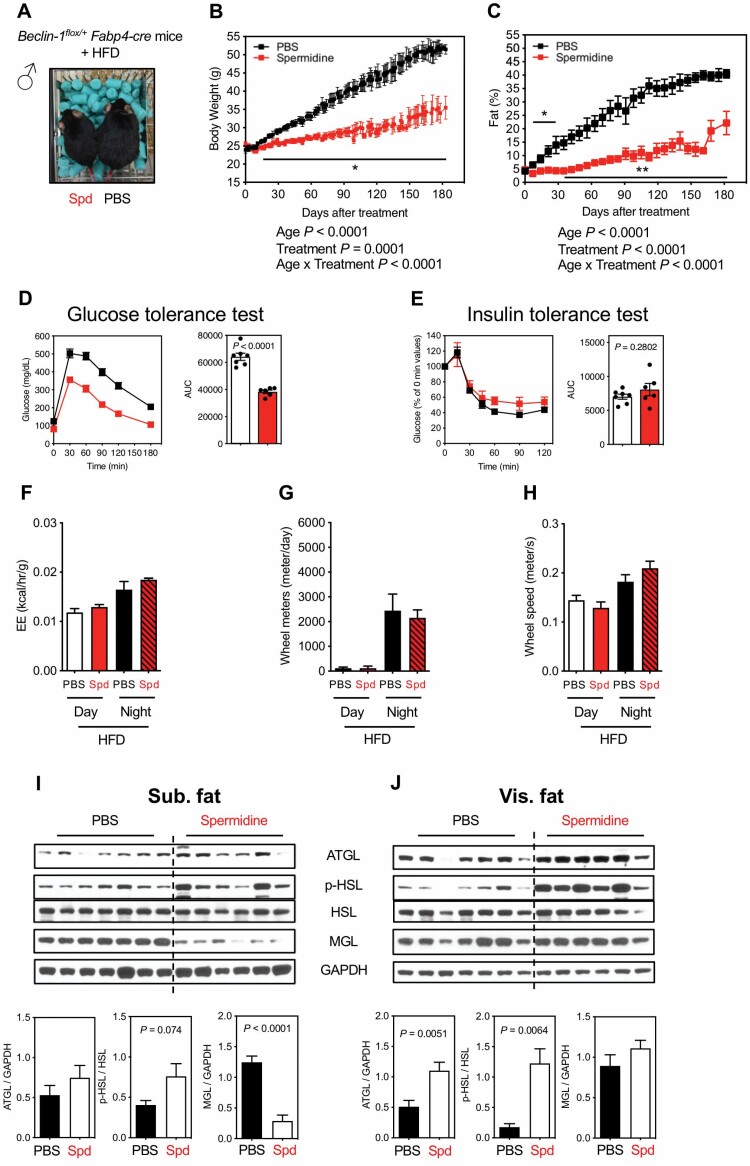
Figure 5.
Effects of Spd on adipose-specific autophagy deficiency male mice under HFD. (A) Image of adipose-specific autophagy-deficient male mice (Beclin-1flox/+Fabp4-cre) under HFD after 3 mo of Spd or PBS treatment (started at 2-month old). (B) Body weight (PBS, black, n = 7; Spd, red, n = 6). (C) Adiposity (PBS, n = 7; Spd, n = 7). (B, C) Statistics for the overall effects of age, treatment, and the interaction represent the p value from a mixed-effects model (restricted maximum likelihood) or 2-way analysis of variance. (D) GTT (PBS, n = 7; Spd, n = 6). (E) ITT (PBS, n = 7; Spd, n = 6). The AUC for GTT or ITT is shown on right panel and each symbol represents a single mouse. (F) EE (kcal/h/g). (G) Wheel meters (m/d). (H) Wheel speed (m/s). n = 4 for PBS and Spd groups from indirect calorimetry (F, G, H). Western blots for the activity of lipolysis, indicated by ATGL, p-HSL, and MGL, from (I) sub. fat and (J) vis. fat of Beclin-1flox/+Fabp4-cre mice under HFD after 6 mo of Spd treatment. Relative ATGL levels (normalized to GAPDH), p-HSL levels (normalized to HSL), and MGL levels (normalized to GAPDH) were quantified underneath. All bars represent mean ± SEM. Significant differences were taken when p < .05. *p <.05; **p <.01. ATGL = adipose triglyceride lipase; AUC = area under the curve; EE = energy expenditure; GAPDH = glyceraldehyde 3-phosphate dehydrogenase; GTT = glucose tolerance test; HFD = high-fat diet; HSL = hormone-sensitive lipase; ITT = insulin tolerance test; MGL = monoacylglycerol lipase; PBS = phosphate-buffered saline; Spd = spermidine; sub. fat = subcutaneous fat; vis. fat = visceral fat.

