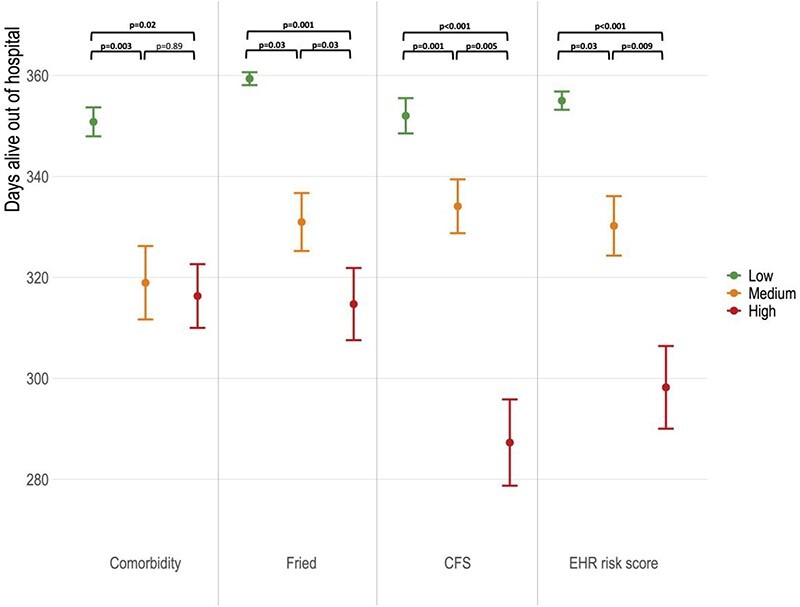
Figure 1 .

Difference in home time in the year following hospital discharge by low, medium and high-risk co-morbidity and frailty tool classifications. Figures presented are mean number of days alive out of hospital at 12 months ± standard error of mean. Between group significance testing undertaken by Wilcoxon pairwise-comparison with correction for multiple testing. Classification of risk groups and detailed modelling outputs are presented in Supplementary Material A3.
