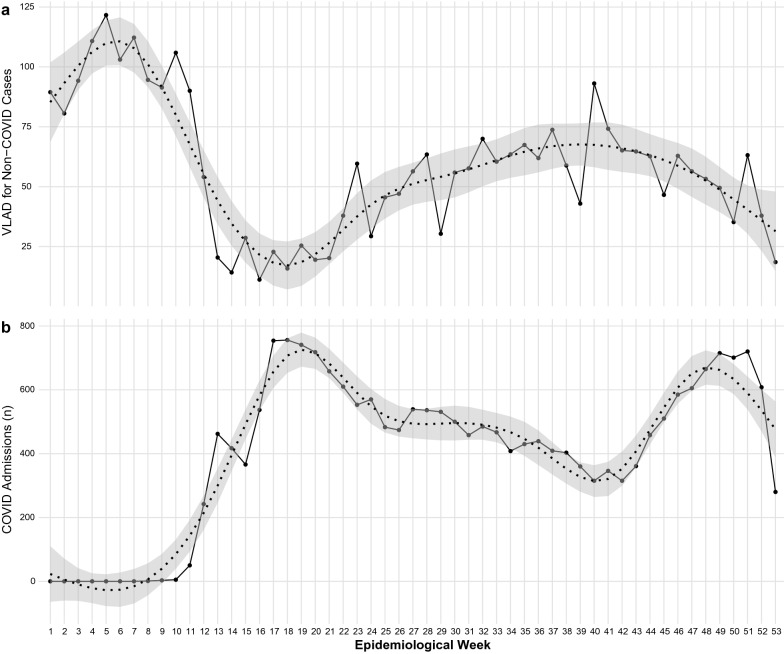
Fig. 2.
(a) Weekly cumulative Variable-adjusted life display (VLAD) during all weeks in 2020. Increases in VLAD suggest a lower-than-expected mortality, while downwards shifts suggest the inverse trend. (b) Number of COVID-19 cases admitted to the participating ICUs during the epidemiological weeks of 2020

