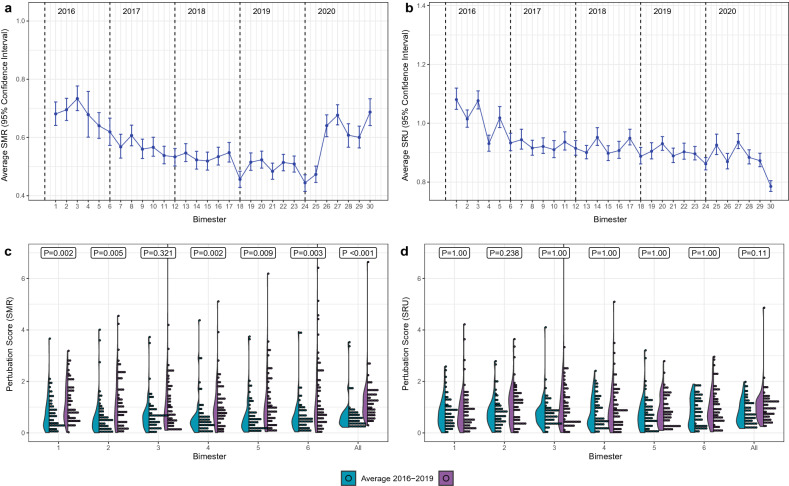
Fig. 4.
Trends in SMR (a) and SRU (b) for 61 ICUs with data available from 2016 to 2020. Error bars represent 95% confidence intervals obtained from 1000 replications bootstrap. The slope of changes in SMR, but not for SRU, in 2020 is different for 2016–2019 (p value for Chow test < 0.001 and 0.113, respectively). Results of the perturbation analysis for SMR (c) and SRU (d) for values before 2020 (blue) and 2019–2019 (purple). Perturbation scores represents how relatively far SMR and SRU values were from to the baseline. A comparison between each bimester in 2020 and baseline, as well as an averaged comparison between 2020 and 16-2019 is shown. p-values for Mann–Whitney U test after Bonferroni correction are shown in boxes

