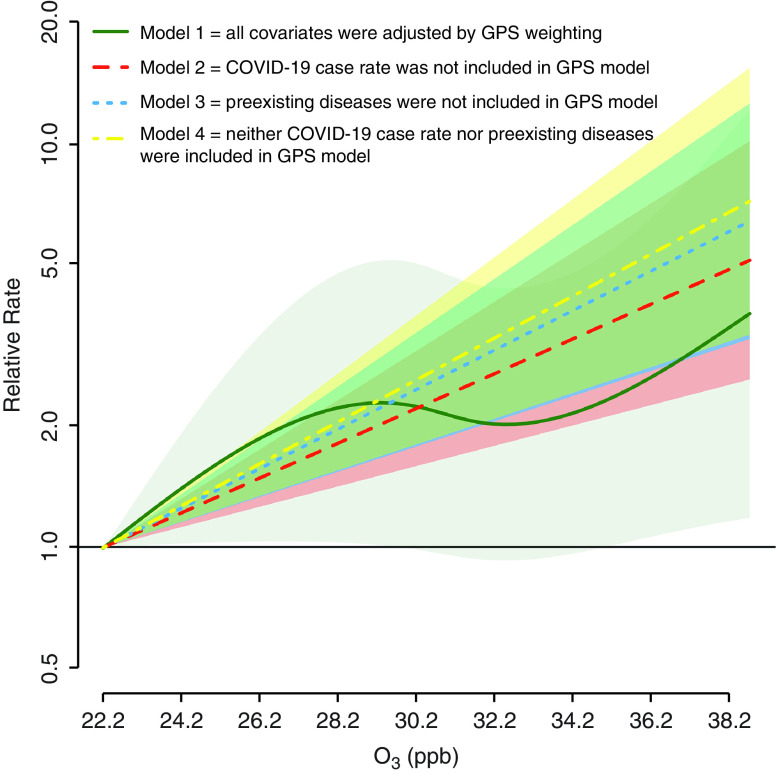
Figure 1.
Association between long-term exposure to O3 and coronavirus disease (COVID-19) mortality risk in New York City. All models were adjusted by GPS weighting. Covariates in Table 1 and its footnote were generally well balanced (absolute correlation <0.10). In addition to the weighting, some covariates were additionally adjusted by covariate adjustment in disease models because their absolute correlations with O3 after GPS weighting were >0.10 (all the correlations were <0.30). These covariates were number of COVID-19 tests performed, percentage of Hispanic population, poverty rate, and asthma (models 1–2); number of COVID-19 tests performed, percentage of population that is white, percentage of population that is Hispanic, poverty rate, crowded housing, average household size, and obesity (model 3); and number of COVID-19 tests performed, percentage of population that is white, percentage of population that is Hispanic, and poverty rate (model 4). The relative rate compares COVID-19 mortality risk at a given level of long-term O3 exposure to the risk at the lowest observed O3 level (22.2 ppb). Shaded areas represent 95% confidence intervals. For model 1, nonlinear terms were better fit than a linear term based on Akaike Information Criteria (1,138.99 vs. 1,140.37). GPS = generalized propensity score; O3 = ozone.

