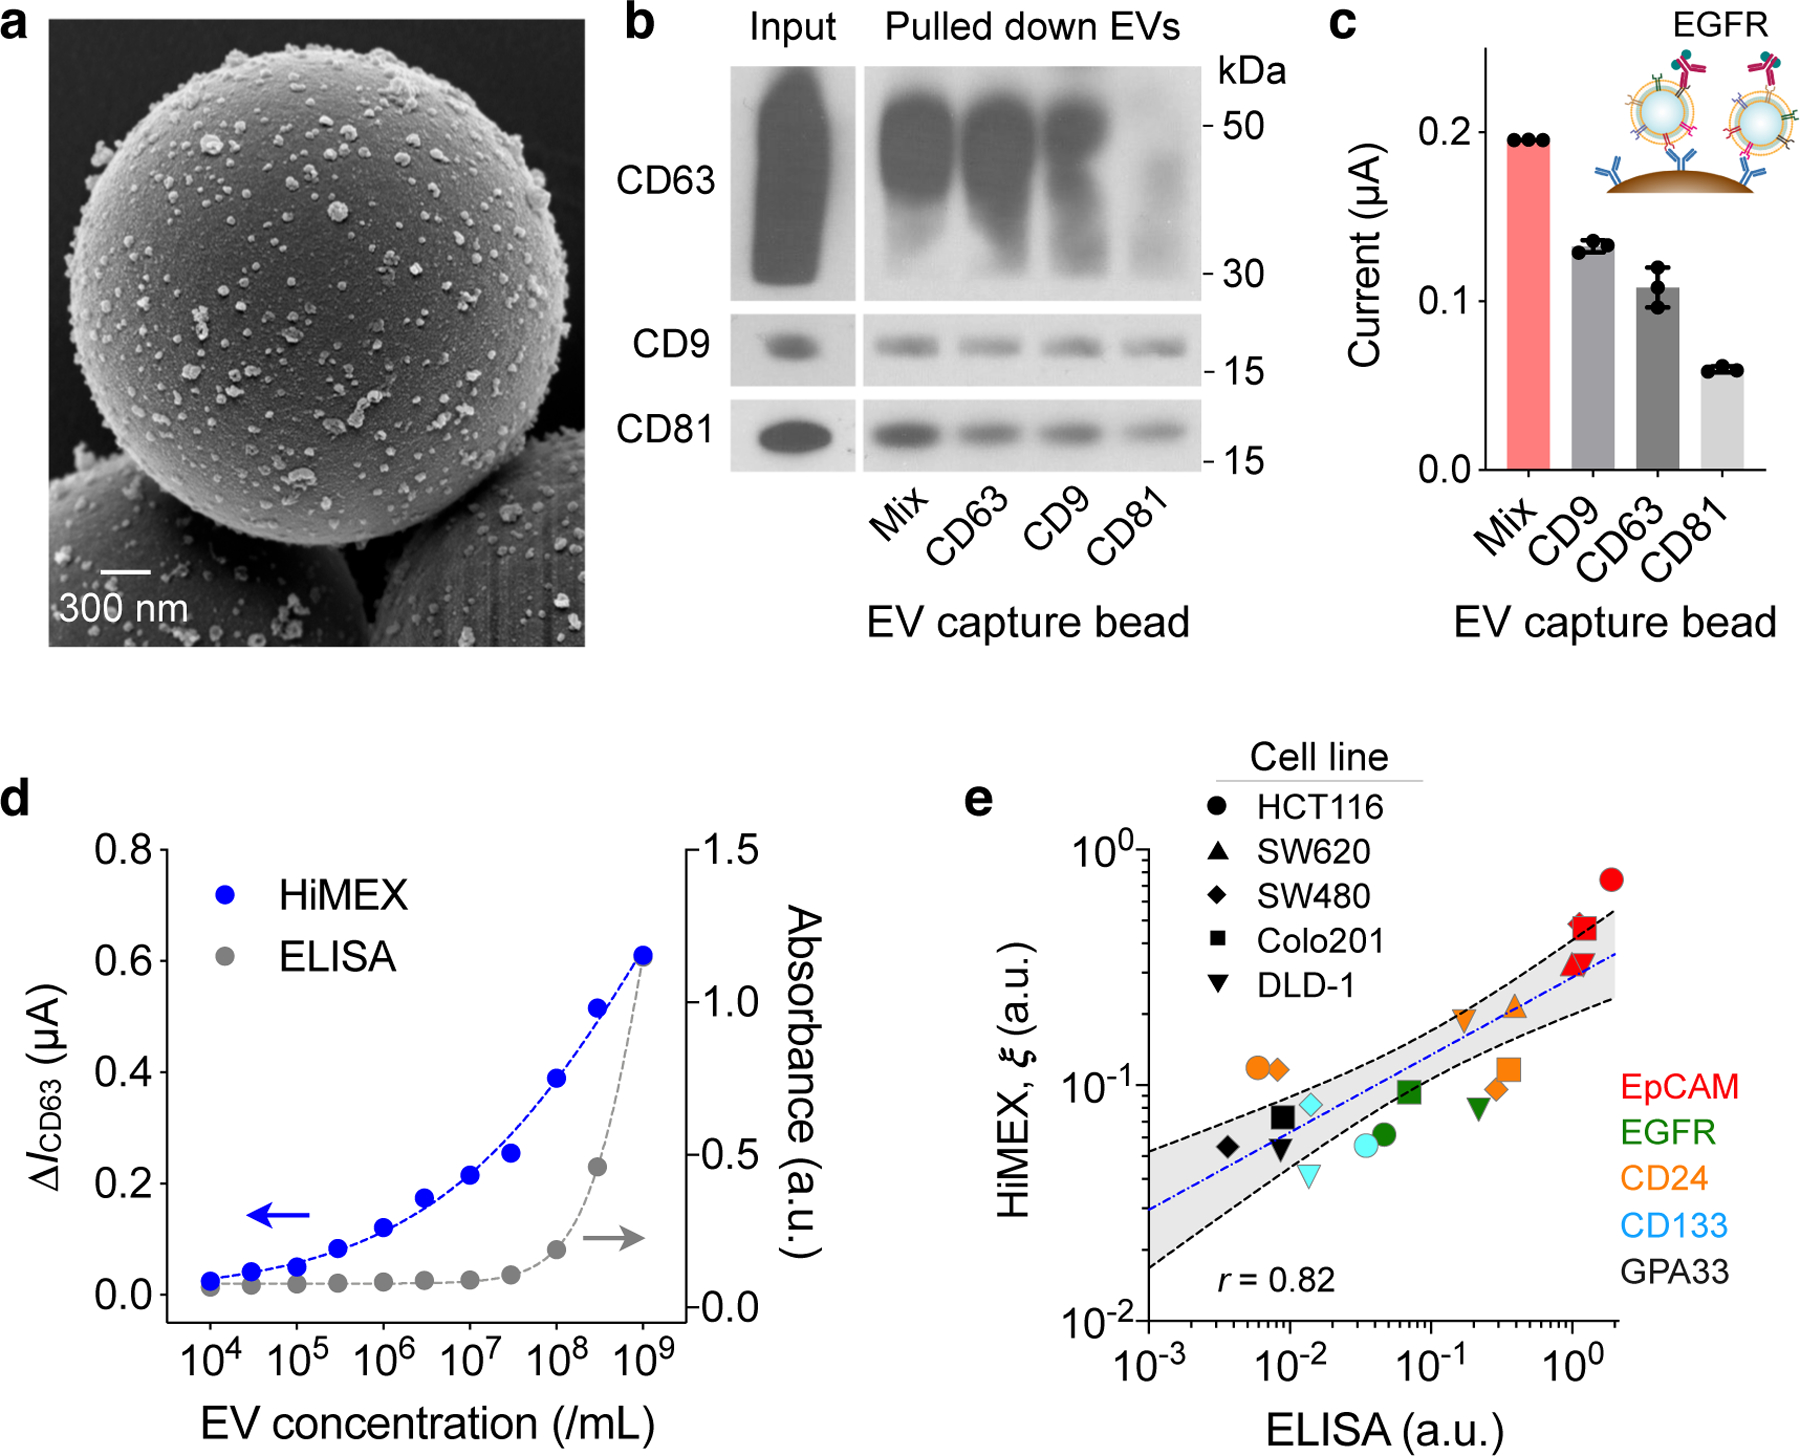
Fig. 2 |. HiMEX assay optimization and characterization.

a, Scanning electron micrograph of microbeads after incubation with EV samples. The beads (diameter, 3 μm), functionalized with antibodies against CD63, captured EVs isolated from a cell culture media (HCT116 cell line). A representative image is selected from technical duplicate samples. b, Three types of magnetic beads, with each type specific to a different tetraspanin, and their mixture (Mix) were used to capture EVs. Key tetraspanin expression was then measured on captured EVs. The bead cocktail most efficiently overcame EV heterogeneity. A representative image is selected from duplicate measurements. Full western blot images are shown in Supplementary Information. c, EVs (107/mL) from HT29 cell lines were captured and further labelled for EGFR. Mixed bead types led to the highest HiMEX signal. The data are displayed as mean ± SD from technical triplicates. d, The HiMEX assay had superior sensitivity and wider dynamic range than conventional ELISA. The limit of detection was ~104 EVs/mL for HiMEX and ~107 EVs/mL for ELISA. a.u., arbitrary unit. EV numbers were estimated from nanoparticle tracking analysis. The data points represent mean from technical duplicates. e, EVs from different CRC cell lines were profiled to a set of protein markers. The HiMEX results showed a good match (Pearson correlation coefficient, r = 0.82) with those from ELISA. To obtain the HiMEX expression (ξ) of a target protein marker (M), the marker-associated current level was normalized against the loading control, the current level of CD63. For ELISA, the same amount of EVs (109 EVs/mL) was used for each marker. Data were plotted in log scales to better display small values. The blue-dashed line indicates the best linear fit in the log-log scale, and the shaded grey area 95% confidence band. HiMEX data represent mean values from technical duplicates.
