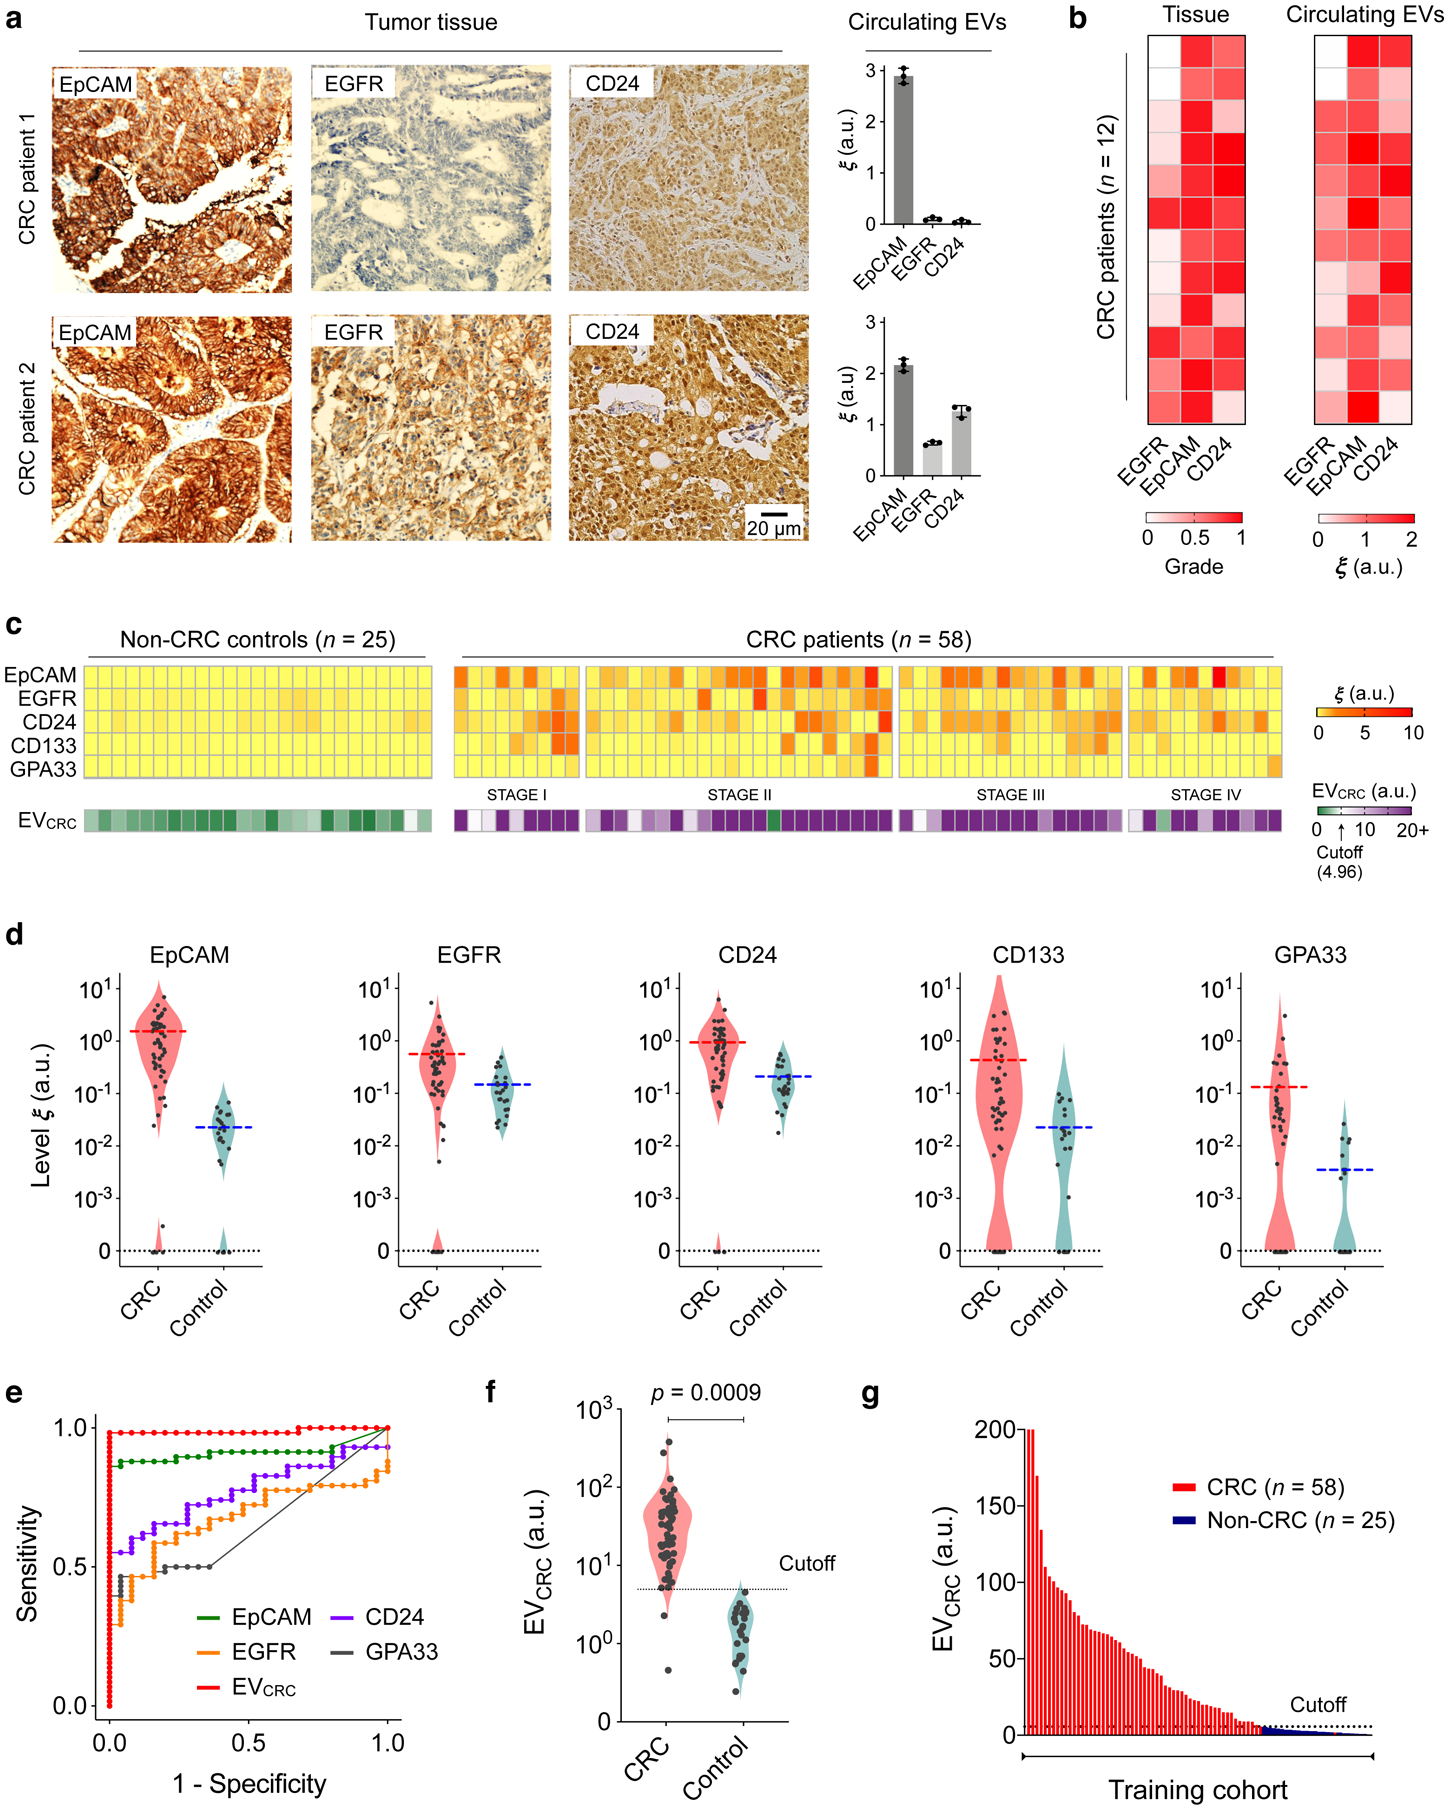
Fig. 3 |. EV profiling for CRC detection.

a, Tumour tissue and plasma EV analyses. Three key CRC protein markers (EpCAM, EGFR, CD24) were assessed in tumour tissues (immunohistochemistry) and blood samples (HiMEX) from each patient. Expression profiles showed a qualitative match. Data from two representative patients are shown. The bar graphs show mean ± SEM from technical triplicate measurements. Full images of these samples are shown in Supplementary Information. b, Tumour tissue and plasma EV samples from 12 CRC patients were analysed for EpCAM, EGFR, and CD24. Tissue staining was graded as the fraction of marker-positive cells among total cancer cells. The pathological score and the EV expression profile showed significant correlation (Spearman rank coefficient ρs = 0.65, p < 0.0001; two-sided test). c, HiMEX analyses for CRC diagnosis. As a training set, plasma samples from 58 CRC patients before surgery and 25 non-CRC controls were analysed. The expression of five CRC markers (EpCAM, EGFR, CD24, CD133, and GPA33) was measured by HiMEX. The diagnostic metric, EVCRC, was determined as a weighted sum of four marker levels (EpCAM, EGFR, CD24, GPA33) through logistic regression. d, The average level of each marker was higher in CRC patients than in non-CRC controls. The marker distribution, however, overlapped between patients and controls, reducing the classification power of single markers. e, For each CRC marker and EVCRC, receiver operating characteristic (ROC) curves were constructed. The area under curve (AUC) of EVCRC was 0.98, significantly larger than those of single markers (all p < 0.001). Cutoff levels that maximized the sum of sensitivity and specificity were determined from the ROC curves. f–g, EVCRC effectively differentiated CRC patients from controls (p = 0.0009; unpaired two-sided t-test). In the training cohort, the diagnostic accuracy was 98%. The cutoff value from the EVCRC ROC curve was 4.96.
