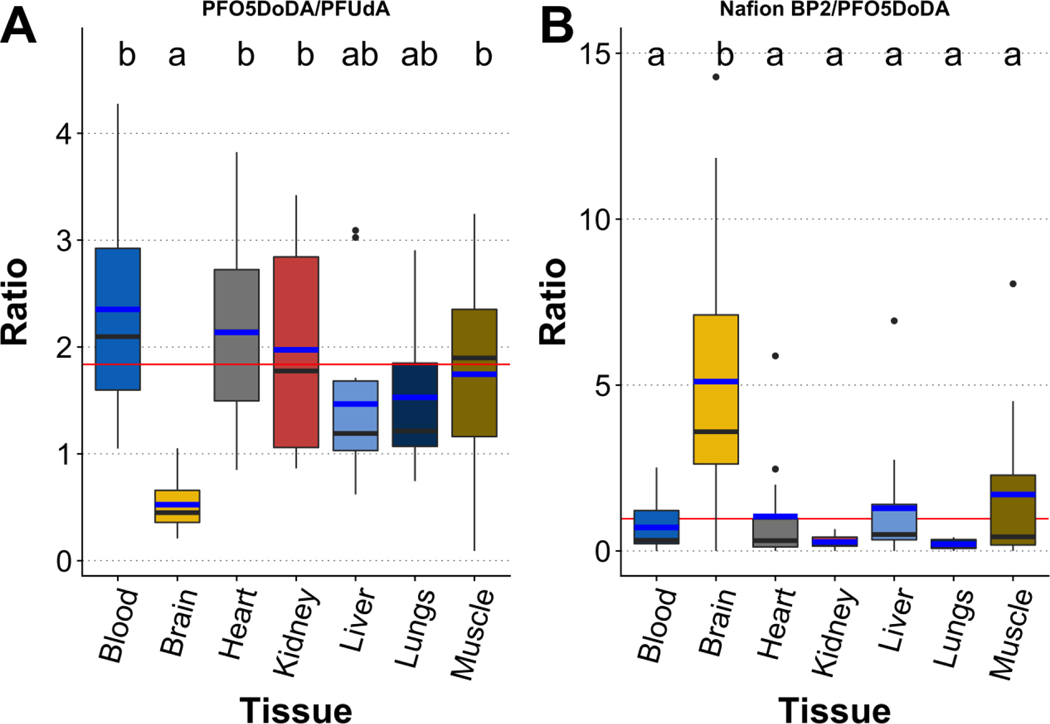
Figure 3.
Ratios of PFAS concentrations in seven tissues from all CFRE individuals, with A) presenting concentrations of PFO5DoDA divided by PFUdA and B) presenting concentrations of Nafion BP2 divided by concentrations of PFO5DoDA. Fat was excluded due to the very low detection frequency of PFO5DoDA and PFUdA in fat. The blue line within each box plot indicates the arithmetic mean while the black line indicates the median. The box hinges represent the first and third quartiles, and the whiskers indicate 1.5 times the interquartile range. Outliers are indicated by black dots. The red line indicates the mean of each concentration ratio including all tissues except brain. Common letters above each boxplot indicate tissues that share statistically indistinguishable concentration ratios as determined using Tukey’s post-hoc test.

