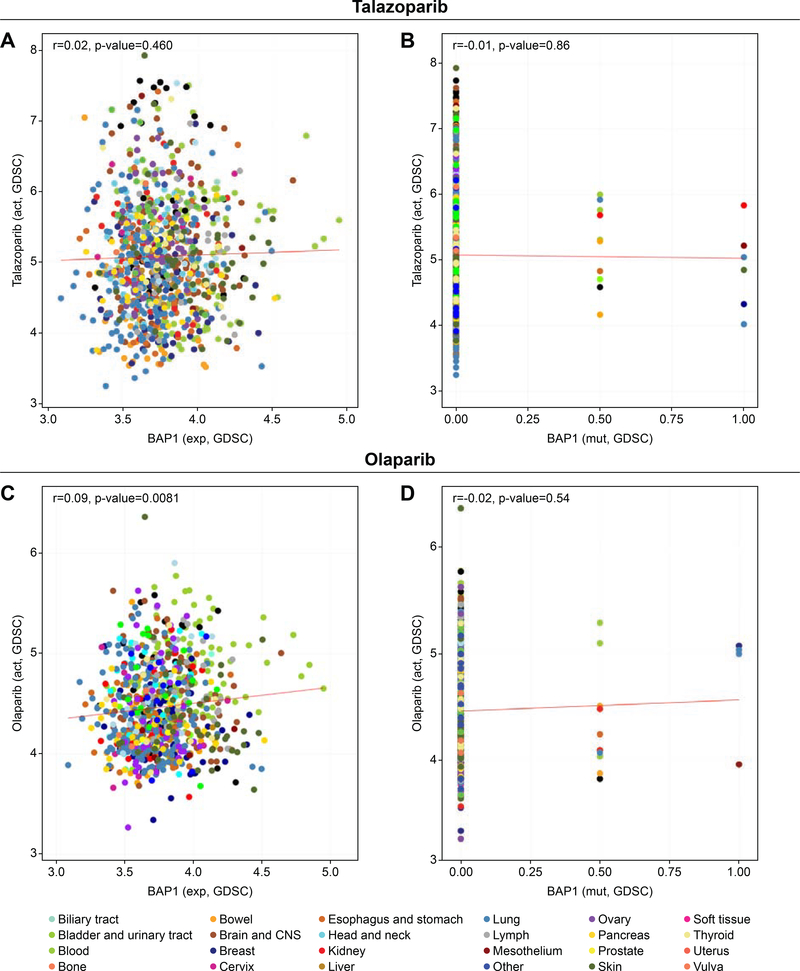
Figure 4. BAP1 expression in different human cancer cell lines including BAP1-mutant does not correlate with sensitivity to the PARPIs talazoparib and olaparib.
The graph created using CellMiner web application (http://discover.nci.nih.gov/cellminercdb) shows representing BAP1 expression (x-axis) and drug sensitivity (y-axis) in the GDSC (Genomics of Drug Sensitivity in Cancer). Colored dot represents single cell lines from the indicated tissues of origin. Pearson’s correlation coefficient (r) and two-sided P value between BAP1 transcript and the PARPIs talazoparib (A) and olaparib (C) are indicated. BAP1-mutant tissues also fail to show any correlation between BAP1 mutations and sensitivity to talazoparib (B) or olaparib (D).

