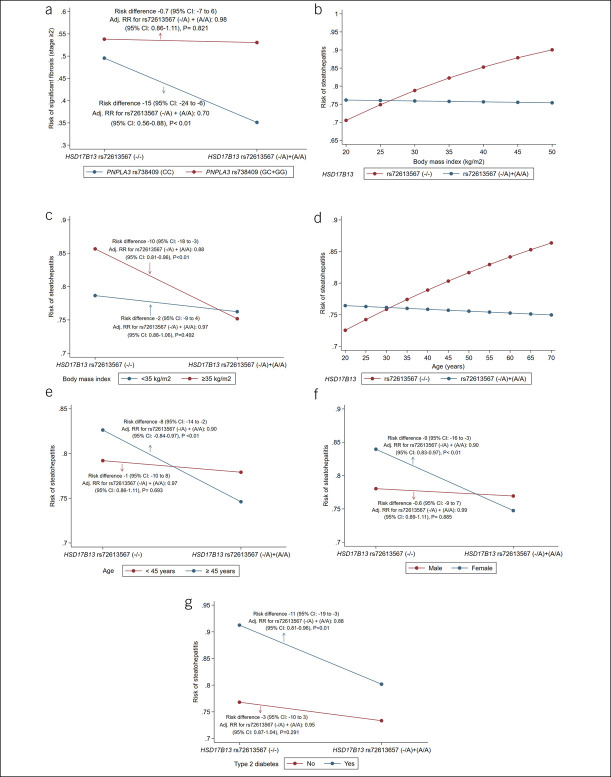
Figure 1.
Effect of HSD17B13 rs72613567 (dominant genetic model) on risk of significant fibrosis or steatohepatitis at levels of moderators. Analysis based on margins plots. (a) PNPLA3 rs738409 (CC, n = 377, and GC + GG, n = 776). (b) Body mass index (continuous). (c) Body mass index (<35, n = 647, and ≥ 35, n = 506). (d) Age (continuous). (e) Age (<45, n = 315, and ≥ 45, n = 838). (f) Sex (women, n = 727, and men, n = 426). (g) Type 2 diabetes (no, n = 745, and yes, n = 408). CI, confidence interval; RR, relative risk. The risk of steatohepatitis includes borderline along with definite steatohepatitis. Analysis adjusted for nonheavy alcohol intake and those covariates not tested as moderators. The reference for all comparative analyses is the HSD17B13 rs72613567 (−/−) genotype. Logistic regression models were used to compute risks of steatohepatitis or significant fibrosis, and margins command to create a visual display of results. Circles on the lines represent average adjusted risks of steatohepatitis or significant fibrosis according to HSD17B13 rs72613567 (−/−) and (−/A) + (A/A) genotypes. Risk difference indicates a change in the risk of having steatohepatitis or significant fibrosis for HSD17B13 rs72613567 (−/A) + (A/A) as compared with (−/−) at levels of moderators.

